

As of late June 2026, XRP trades at $1.09 — a level that appears deceptively calm. The Ripple price is trapped below key EMAs, and the daily chart tells a bearish story that shorter timeframes are quietly trying to contradict.
Summary
Key takeaways
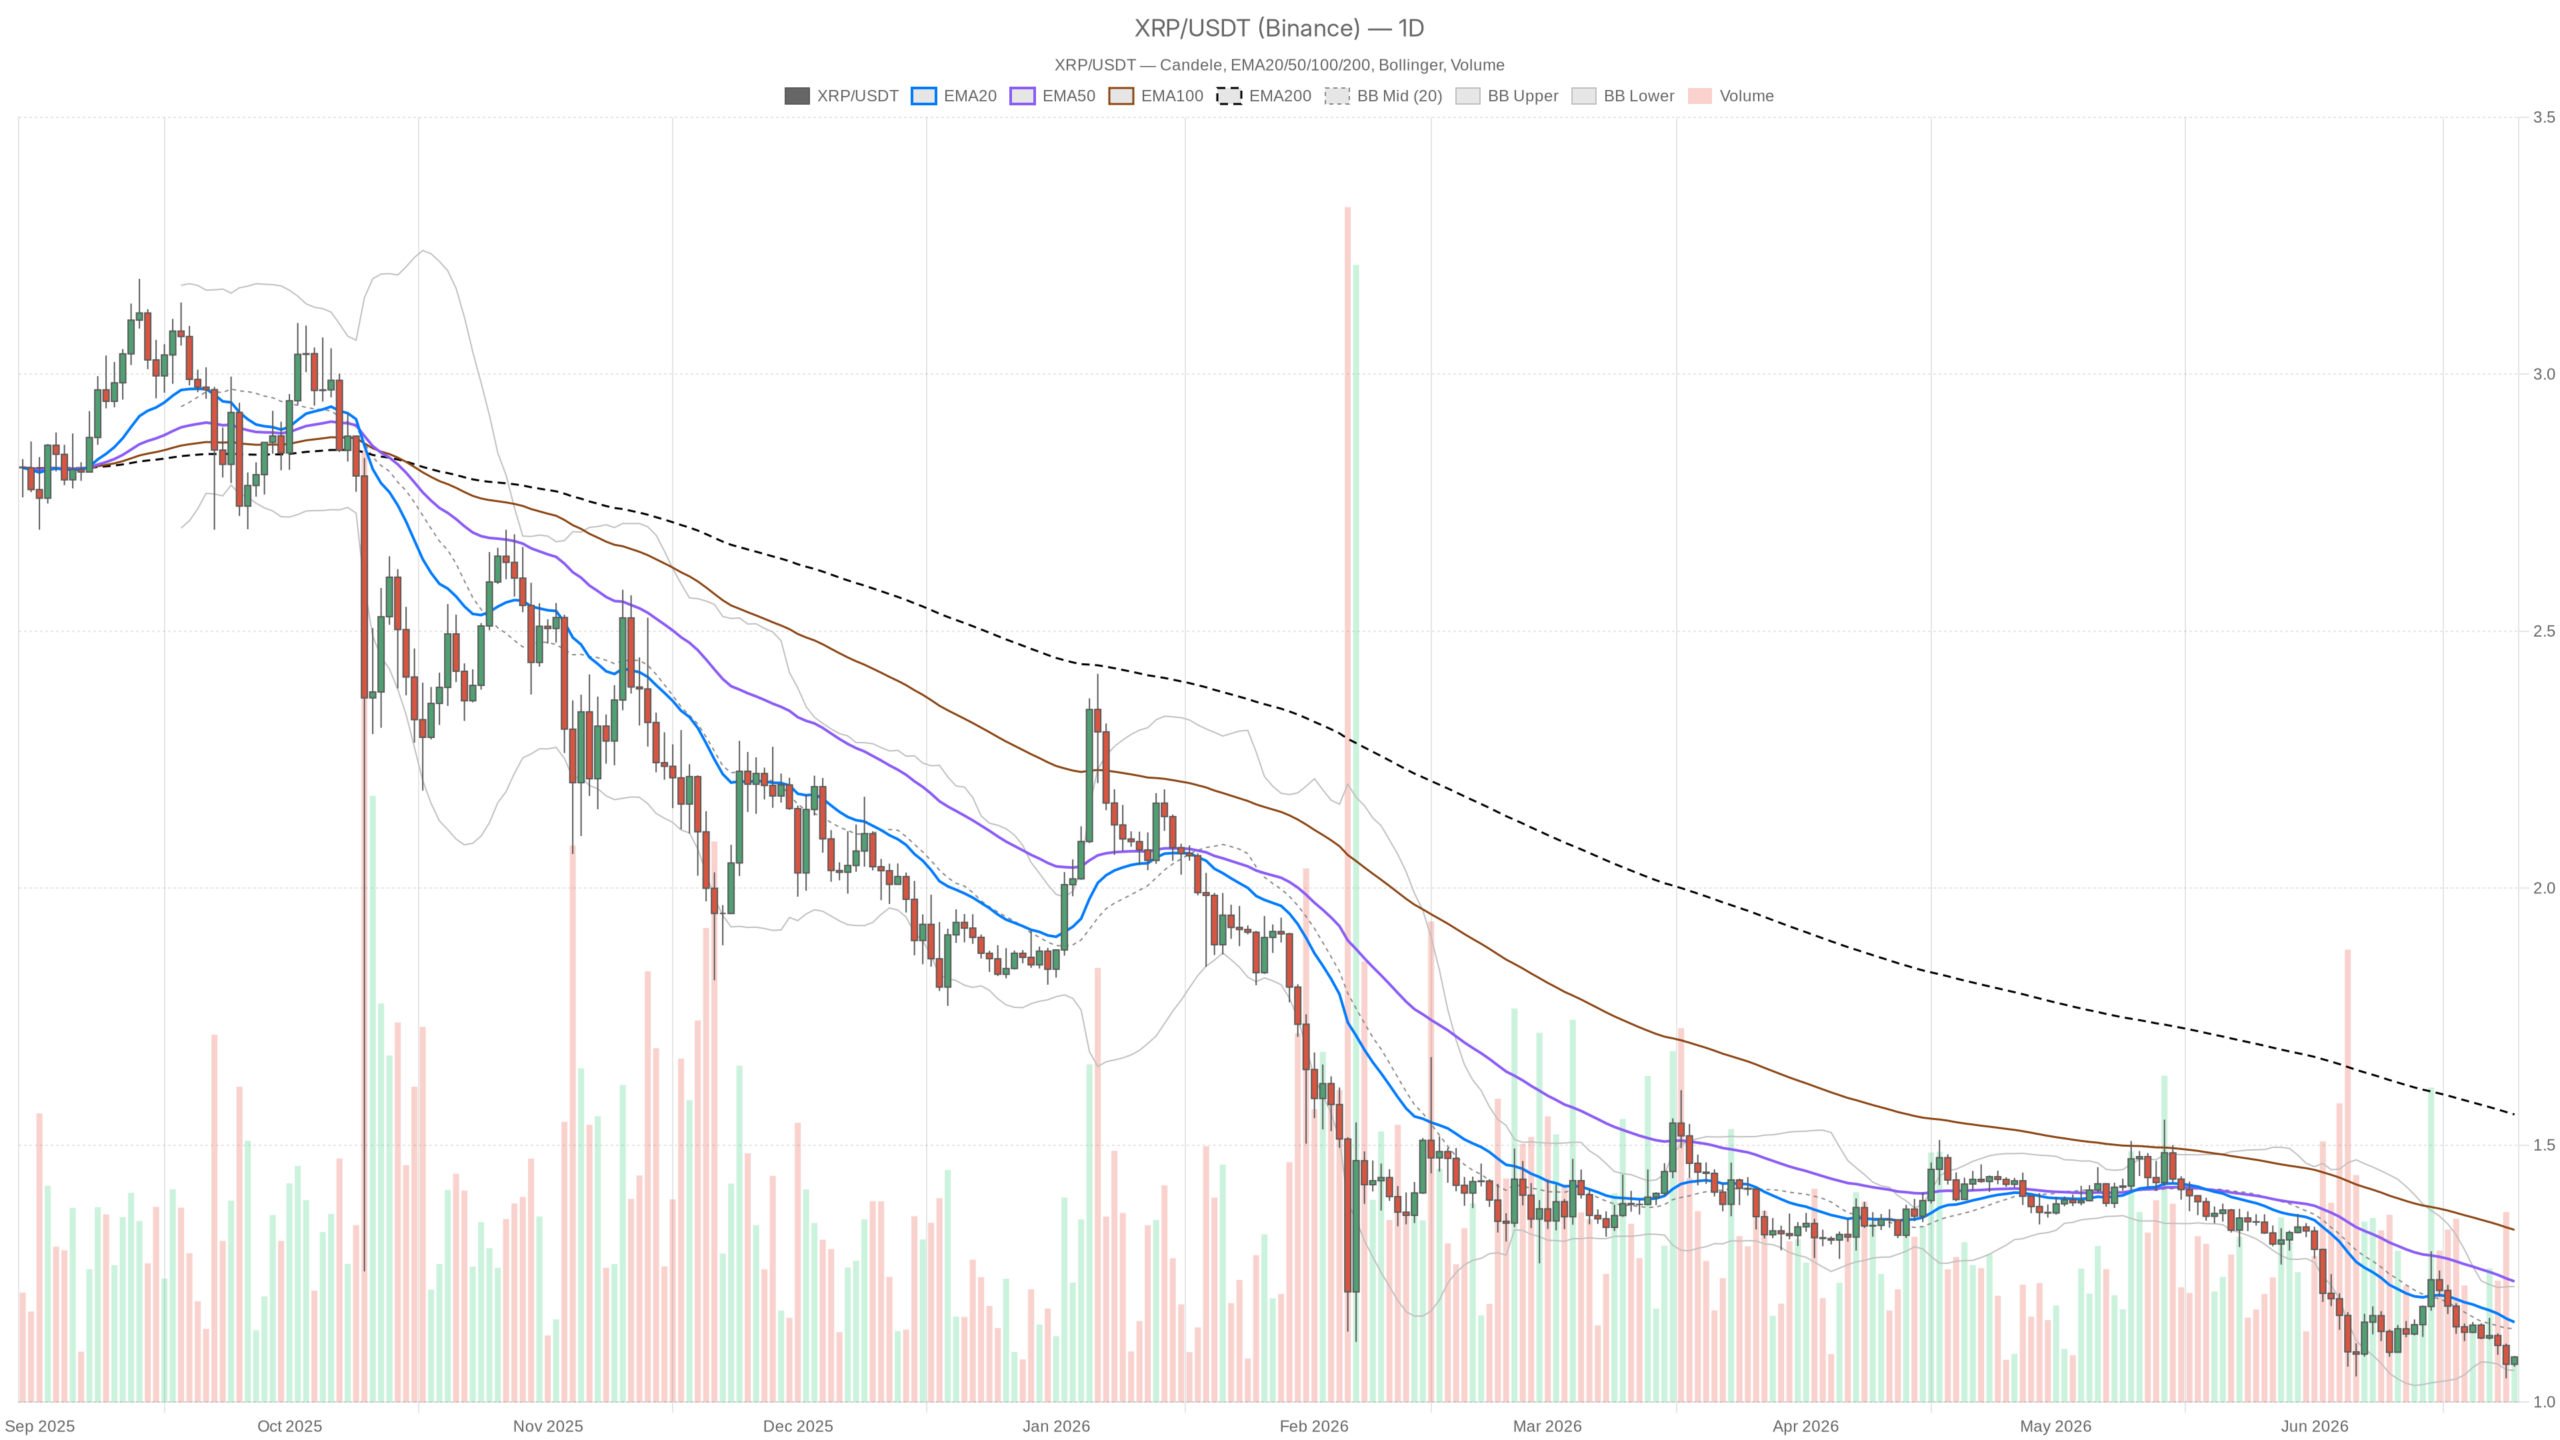
- XRP is trading at $1.09, trapped below the daily EMA20 at $1.16 and EMA50 at $1.23, both sloping downward.
- The daily RSI at 36.35 confirms bearish momentum without reaching oversold extremes that would signal a bounce.
- Bollinger Bands show compression between $1.06 support and the $1.14 midband, with an ATR of $0.05 implying 4.5% daily swings.
- The Fear & Greed Index has collapsed to 12 — Extreme Fear — while Bitcoin dominance holds above 56%.
- A daily close above $1.16 is needed to shift the bearish narrative; a break below $1.06 opens the path toward $1.00.
The Daily Chart: A Bearish Regime With No Clear Reversal Signal Yet
XRP is trading at $1.09. The EMA20 sits at $1.16 and the EMA50 at $1.23 — both above price, both sloping downward, and both acting as dynamic resistance. The EMA200 at $1.56 is so far overhead it barely enters the conversation. This stacking tells you every meaningful average is pointing down. Rallies into $1.16 will face immediate selling pressure unless the tape changes character decisively.
The daily RSI at 36.35 hovers just above the classical oversold boundary without crossing it. It is weak enough to confirm the bearish trend but not so beaten down that a snapback bounce is guaranteed. Markets can stay in this RSI range for extended periods during genuine downtrends. It is a warning light, not a buy signal.
The MACD on the daily is flat — line at -0.04, signal at -0.04, histogram at zero. That zero histogram sounds neutral, but sitting at negative values with zero momentum means the trend is neither accelerating nor reversing. It is stalled in bearish territory. Until the histogram begins printing positive bars consistently, there is no technical case for a trend change.
Bollinger Bands frame the situation well: the midband is at $1.14, the upper band at $1.23 — coinciding with EMA50 resistance — and the lower band at $1.06. Price is pressing toward the lower band, which historically implies stretched conditions. However, in trending markets, price can walk the lower band for weeks. The ATR of $0.05 means the average daily range is roughly 4.5% of current price. Moves of $0.05 to $0.10 are normal and should not be mistaken for directional breakouts.
Daily pivot levels show the PP at $1.08, R1 at $1.10, and S1 at $1.07. XRP is essentially sandwiched between S1 and R1 in a $0.03 band. This compression zone signals indecision at the micro level even as the macro structure stays bearish.
Hourly: A Flicker of Life, But Do Not Overread It
On the 1H chart, the picture shifts modestly. The EMA20 at $1.08 and EMA50 at $1.09 are both below or near current price. Price sits at the upper Bollinger Band on this timeframe at $1.09. RSI at 55.08 is above the midpoint — a mild positive showing short-term momentum has turned constructive. Moreover, the hourly MACD histogram has crossed to slightly positive, the weakest possible bullish crossover but a crossover nonetheless.
What this means practically: the 1H is giving bulls a small window. Price has reclaimed the short-term EMAs and RSI has momentum above 50. However, the 1H EMA200 at $1.13 looms as a serious ceiling. Any intraday rally that cannot clear $1.13 convincingly is just noise within the larger bearish structure defined by the daily chart.
15-Minute: Overbought Into Resistance
The 15-minute chart shows a RSI of 65.38 — approaching overbought on the execution timeframe. With the 15M EMA200 sitting right at $1.09 and the upper Bollinger Band capping at the same level, XRP is running into a cluster of resistance. The ATR on this timeframe is essentially zero, confirming the price compression. For traders seeking entries, buying into a 65 RSI at the top of a 15M Bollinger Band — while the daily trend is bearish — is a low-probability setup. This timeframe mainly confirms that any short-term push higher is already stretched.
The Bullish Case: Conditional and Fragile
For bulls, the scenario that matters begins with holding $1.07 — daily S1 and lower Bollinger Band support. If XRP can consolidate above $1.08 to $1.09 with hourly momentum continuing to build, a test of the daily EMA20 at $1.16 becomes plausible. A clean break and close above $1.16 on the daily would be the first meaningful structural improvement in weeks. It would signal the EMA stack is beginning to compress and potentially reverse. The daily RSI bouncing from the mid-30s without a new price low would add significant weight to this scenario.
What would invalidate it: a daily close below $1.06 — the lower Bollinger Band — would break the current support shelf. That would open the door toward $1.00 and below with very little technical structure in between.
The Bearish Case: Structurally Well-Supported
The bears have the trend, the EMA structure, the macro sentiment, and the MACD on their side. The base case remains that any bounce toward $1.13 to $1.16 is a selling opportunity rather than a recovery. The 1H EMA200 at $1.13 is the first real test. Failure there would confirm bears are still firmly in control. A rejection from $1.13 followed by a break of $1.07 daily support would open a move toward the $1.00 psychological level and potentially lower.
What would invalidate it: a daily close above $1.23 — EMA50 and upper Bollinger Band confluence — would represent a genuine regime change. That is unlikely given current momentum, but worth watching if market-wide risk appetite shifts dramatically.
Reading the Room
The Ripple price at $1.09 reflects a market in compression, operating within a bearish macro trend. The Fear & Greed Index at 12 signals most participants are either sidelined or defensively positioned. The short-term hourly signals provide a glimmer of tactical opportunity for those with tight risk parameters. However, the daily structure has not yet earned a bullish stance.
XRP needs to prove itself above $1.16 before the narrative shifts. Until then, volatility within the $1.07 to $1.13 range is the most likely outcome. With an ATR suggesting $0.05 daily swings, that range can feel violent even when it is not directional. Sizing accordingly and respecting the dominant daily trend is the discipline this environment demands. Anyone pressing hard longs in the current macro climate needs to be clear-eyed about what they are fighting against.
FAQ
What is the key support level for XRP right now?
The critical support zone sits at $1.06 to $1.07, marked by the daily S1 pivot and the lower Bollinger Band. A daily close below $1.06 would likely open the path toward the $1.00 psychological level.
What needs to happen for XRP to flip bullish?
A daily close above $1.16 — the EMA20 — would be the first meaningful structural improvement. To confirm a genuine regime change, XRP would need to close above $1.23, where the EMA50 and upper Bollinger Band converge.
Why does the Fear & Greed Index matter for XRP?
With the index at 12 — Extreme Fear — most market participants are either sidelined or defensively positioned. This macro sentiment headwind makes it harder for any bullish breakout to gain traction, especially with Bitcoin dominance above 56%.
Disclaimer: This article is for informational purposes only and does not constitute financial advice, an investment recommendation, or a solicitation to buy or sell any financial instrument or cryptocurrency. The analysis provided is not indicative of future results. Investing in crypto assets and financial markets carries a high risk of capital loss. Always do your own research (DYOR) and consult a qualified financial advisor before making any decision.
Article produced with the assistance of artificial intelligence and reviewed by the editorial team.