

The MACD indicator is one of the most famous indicators in the financial world and widely used in trading, including crypto.
Summary
MACD: what it embodies
MACD stands for Moving Average Convergence Divergence.
This is an oscillator used in market technical analysis which combines several principles.
It was developed by Gerald Appel and is based on exponential moving averages. These provide different information depending on the temporal domain to which they refer. The shorter the average, the more reactive it is.
The crossing of two moving averages of different temporal domain indicates the change in the trend of a price.
The MACD is nothing more than an indicator based on this concept that explores possible trends and identifies changes in market direction.
MACD: how it works in detail
This indicator was introduced with the aim of representing the interaction of two exponential moving averages with a well defined time domain.
The fastest-moving average is set to 12 periods and the slowest to 26 periods. The temporal parameters can be set at will but, by changing them, the point of strength would be sacrificed, which corresponds to the reliability owed to its wide use in trading.
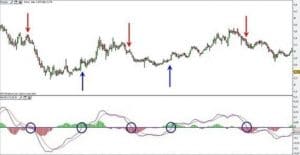
The MACD is based on a simple principle: the fast average will record, before the slow one, the change in the directions of the price, while the intersection with the longer-term one should identify the start of a trend.
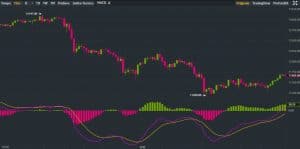
The intersection of the two averages is displayed with the value “0” on the indicator. Above the zero line, the trend is classified as bullish, while below it as bearish.
Sometimes, there is a third line of a different colour, set on the 9 periods, that represents the average of the two previous lines.
The MACD indicator allows understanding the market trend both in terms of average and statistical data. By trading on the intersection of the “0” value centerline, it is possible to buy at the birth of a positive trend and sell at the birth of a bearish trend.
It is necessary to remember that all the information that can be obtained from most of the indicators does not represent the absolute truth and can often generate false signals.