




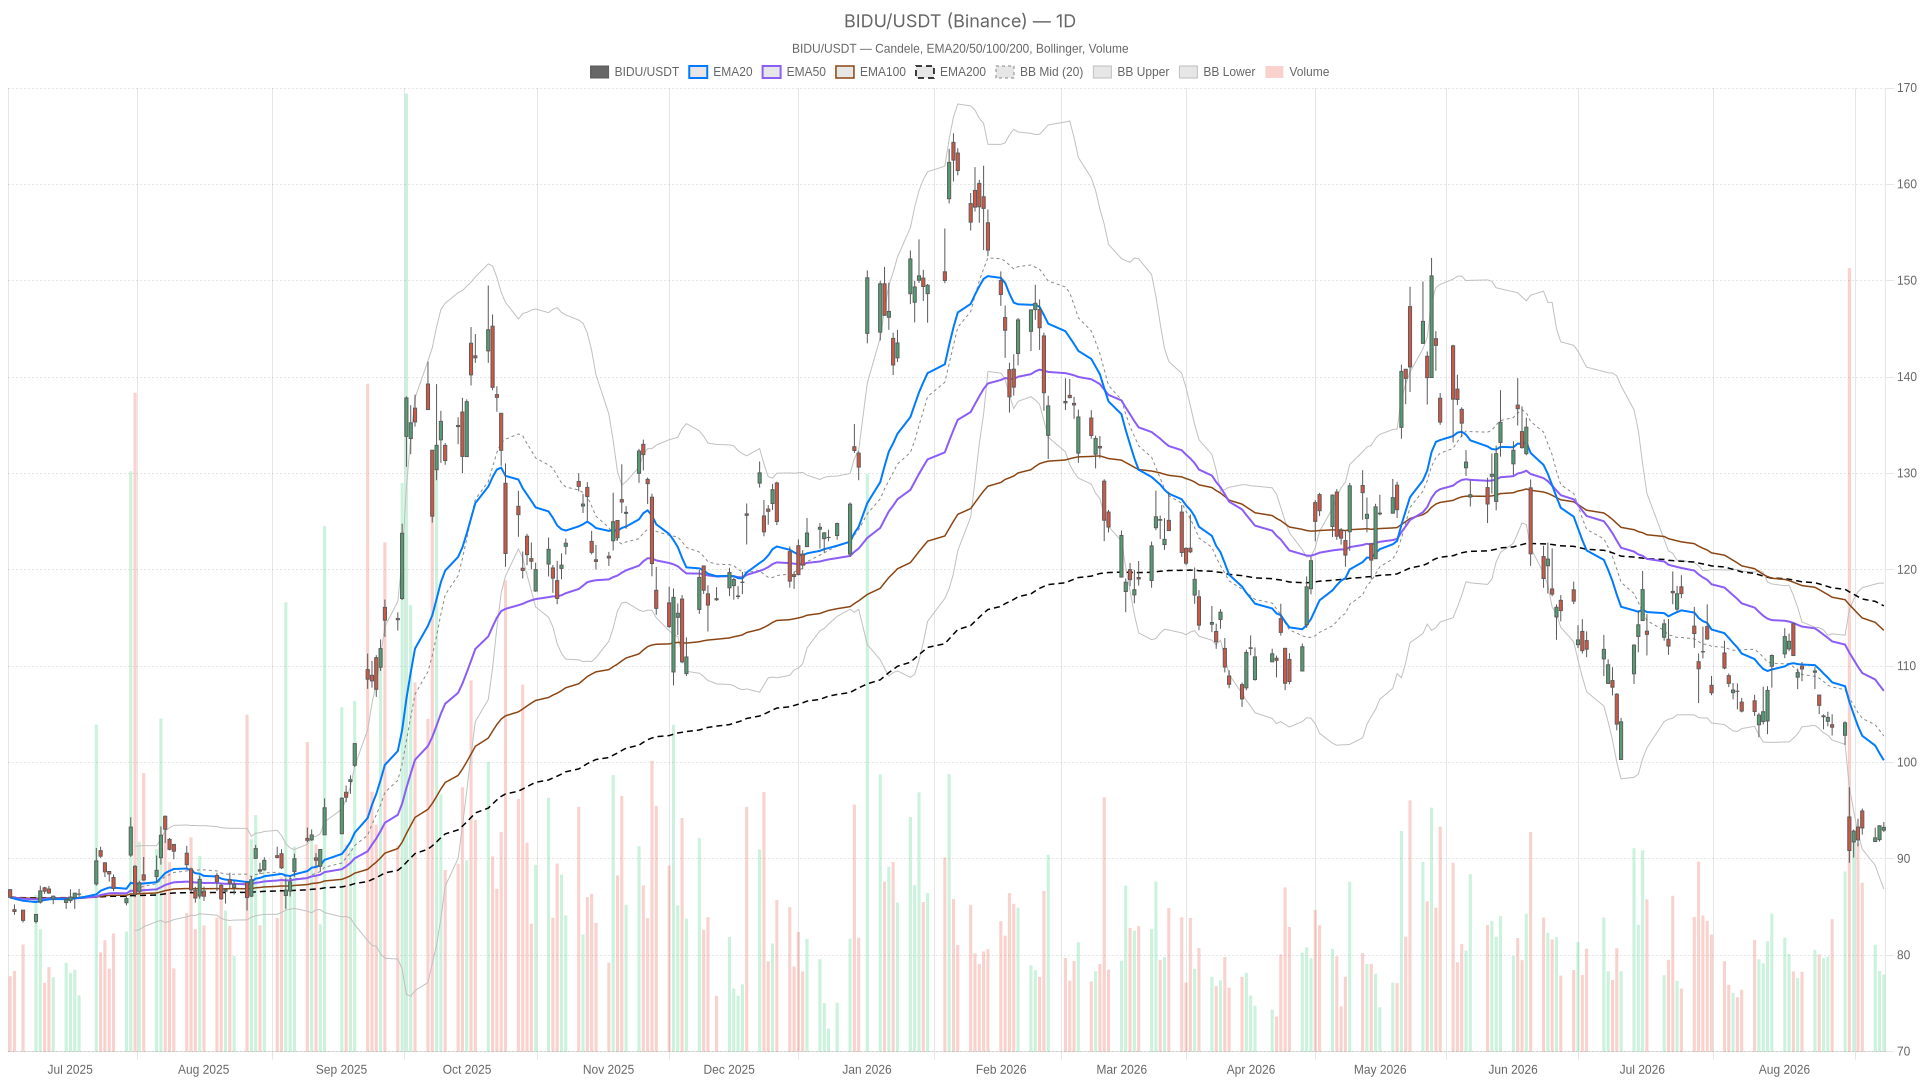
Baidu stock remains caught in a stubborn daily downtrend, even as the shorter-term chart shows early stabilization. The stock closed Wednesday’s session at 93.26, still beneath every major daily moving average. That higher-timeframe trend versus the more balanced hourly tape is the central tension shaping this setup.
Summary
Key takeaways
- Baidu stock closed Wednesday at 93.26, below all major daily moving averages.
- The stock fell 12.7% after revenue dropped 4% year over year to RMB31.3 billion.
- The daily chart remains in a bearish regime, with daily RSI14 at 31.6.
- Hourly and 15-minute charts show neutral regimes, signaling a pause rather than a reversal.
- Daily resistance starts at 93.81, while support sits at 92.75.
What’s Behind the Decline in Baidu Stock
Baidu stock is under pressure because a fundamental miss and a technical breakdown reinforced each other after the latest earnings release. Specifically, the stock sank 12.7%, while revenue fell 4% year over year to RMB31.3 billion. That figure missed consensus estimates of roughly RMB32.0 billion.
Non-GAAP diluted earnings per ADS of RMB7.22 also came in below expectations. The market reaction was swift, and technical damage followed. Baidu’s chart fell below its key moving averages in the days after the report. That combination of a fundamental miss and broken technical structure is why the daily bias remains firmly bearish.
Daily Chart: Bearish Regime Confirmed by Trend and Momentum
The daily chart confirms a bearish regime: price trades below every major moving average, and momentum remains negative. Price sits at 93.26, well under the EMA20 at 100.23, the EMA50 at 107.44, and the EMA200 at 116.26. That stacked alignment, with all averages sloping down and above current price, is a bearish trend structure.
Momentum and Volatility Context
Momentum tells a similar story, though with a small nuance. The daily RSI14 sits at 31.6, edging toward oversold territory without quite reaching it. That level suggests selling pressure has been intense. It also raises the question of how much further downside momentum can extend before buyers start testing the waters.
Meanwhile, the daily MACD line at -4.97 remains well below its signal line at -4.05, with a histogram reading of -0.93. The negative histogram confirms the downtrend is still active. Still, the gap between line and signal is narrower than a full-blown momentum collapse would suggest.
At the same time, volatility has clearly expanded around this move. The daily Bollinger Bands show a wide spread, with the upper band at 118.61 and the lower band at 86.88. The midline sits at 102.75. That kind of spread typically follows a sharp repricing event, in this case the post-earnings selloff.
The ATR14 reading of 3.22 reinforces that Baidu is trading with real daily range right now. This is not the kind of quiet drift that invites complacency. For traders watching BIDU stock price action, that elevated volatility is itself a signal to size positions carefully.
Pivot levels on the daily chart place the pivot point at 93.29, essentially where price is trading. Resistance sits at 93.81, and support sits at 92.75. That tight band around the pivot suggests the market is digesting the recent drop rather than committing to a fresh directional push.
Hourly and 15-Minute View: A Pause, Not a Reversal
Shorter timeframes show a pause, not a reversal. The 1H chart has shifted to a neutral regime, even as the daily trend stays bearish. Price at 93.29 sits just above the EMA20 of 93.05. It remains beneath the EMA50 at 94.55 and far below the EMA200 at 101.91.
RSI14 on the hourly chart sits at 51.15, essentially neutral and a far cry from the daily’s 31.6. In contrast to the daily momentum picture, this looks like a market that has stopped falling, at least for the moment.
Hourly MACD supports that read. The line at -0.1 sits just below the signal at -0.26, but the histogram has flipped to a small positive 0.16. That is not evidence of a trend reversal. Still, it suggests short-term selling pressure has eased.
Bollinger Bands on the hourly chart are tight, with the mid at 92.8, upper at 93.6, and lower at 92. That indicates a compression phase rather than an expansion. ATR14 has dropped sharply to 0.54 on this timeframe, consistent with the market catching its breath.
15-Minute Chart Stays Flat and Neutral
Zooming into the 15-minute chart, the picture stays neutral and fairly flat. Price at 93.29 is just above both the EMA20 (93.16) and EMA50 (93.00), though still under the EMA200 at 94.67. RSI14 reads 55.6, mildly constructive but not aggressive.
Here too, the MACD line and signal are essentially overlapping at 0.11 and 0.11, with a histogram of zero. That means momentum has gone quiet at the execution level. Bollinger Bands are narrow here too, with an ATR14 of just 0.17. This reinforces that intraday traders face a low-volatility consolidation window rather than a clear breakout setup.
Bullish Scenario for Baidu Stock
A bullish recovery in Baidu stock is possible, but it would require more than short-term stabilization. The first real upside test sits at the daily R1 pivot of 93.81. A more significant hurdle is the daily EMA20 near 100.23.
On the upside, a sustained move above the hourly EMA50 at 94.55 would help confirm that buyers are gaining control beyond the immediate intraday bounce. A daily RSI push back above 40 would strengthen the case that the selloff has run its course. A positive daily MACD histogram would reinforce that signal.
Notably, the Apollo Go expansion adds a positive strategic data point. Uber is launching Baidu’s fully driverless robotaxi service in Dubai. That could support sentiment if broader market conditions cooperate.
Bearish Scenario and What Would Invalidate Recovery Hopes
The bearish case remains the path of least resistance until proven otherwise. A failure to hold the daily pivot at 93.29 would signal that sellers are still in control. That failure would be followed by a break below the S1 support at 92.75.
In turn, if the hourly RSI rolls back below 50 and the hourly MACD histogram turns negative again, the tentative stabilization signal would weaken. That would remove the offset currently softening the daily bearish regime.
Ultimately, a renewed slide toward the lower Bollinger Band region would confirm that the broader downtrend is reasserting itself. Continued weakness tied to the underlying earnings miss and the 4% revenue decline would add pressure over any short-term calm.
Closing Take: Baidu Stock Outlook
Overall, Baidu stock sits at a genuine crossroads between timeframes. The daily chart shows a clear bearish regime, with price trading well under all major moving averages. Momentum remains negative, even as RSI approaches oversold levels.
The hourly and 15-minute charts, however, show a market that has paused. Regimes are neutral, momentum has flattened, and volatility has compressed. That divergence does not resolve the bigger-picture bearish bias. Still, it suggests near-term price action could stay choppy before the next directional move confirms itself.
Consequently, volatility remains a defining feature of this setup. The daily Bollinger Band spread remains wide, and ATR readings are elevated after the earnings-driven drop. Positioning around these levels calls for discipline rather than conviction in either direction.
FAQ
Why did Baidu stock fall 12.7%?
Baidu stock fell 12.7% after the latest earnings release. Revenue declined 4% year over year to RMB31.3 billion, missing consensus estimates of roughly RMB32.0 billion. Non-GAAP diluted earnings per ADS of RMB7.22 also came in below expectations.
What is the current daily trend for BIDU?
The daily chart remains in a bearish regime. Price at 93.26 trades below the EMA20 at 100.23, the EMA50 at 107.44, and the EMA200 at 116.26. Daily RSI14 sits at 31.6, near oversold territory.
Where are the key support and resistance levels for Baidu stock?
The daily pivot point sits at 93.29. Resistance starts at 93.81, and support sits at 92.75. The daily EMA20 near 100.23 is the more significant upside hurdle.
Is the short-term chart signaling a reversal?
Not yet. The hourly and 15-minute charts show neutral regimes and compressed volatility. That signals a pause rather than a confirmed reversal.
Disclaimer: This article is for informational purposes only and does not constitute financial advice, an investment recommendation, or a solicitation to buy or sell any financial instrument or cryptocurrency. The analysis provided is not indicative of future results. Investing in crypto assets and financial markets carries a high risk of capital loss. Always do your own research (DYOR) and consult a qualified financial advisor before making any decision.
Article produced with the assistance of artificial intelligence and reviewed by the editorial team.
