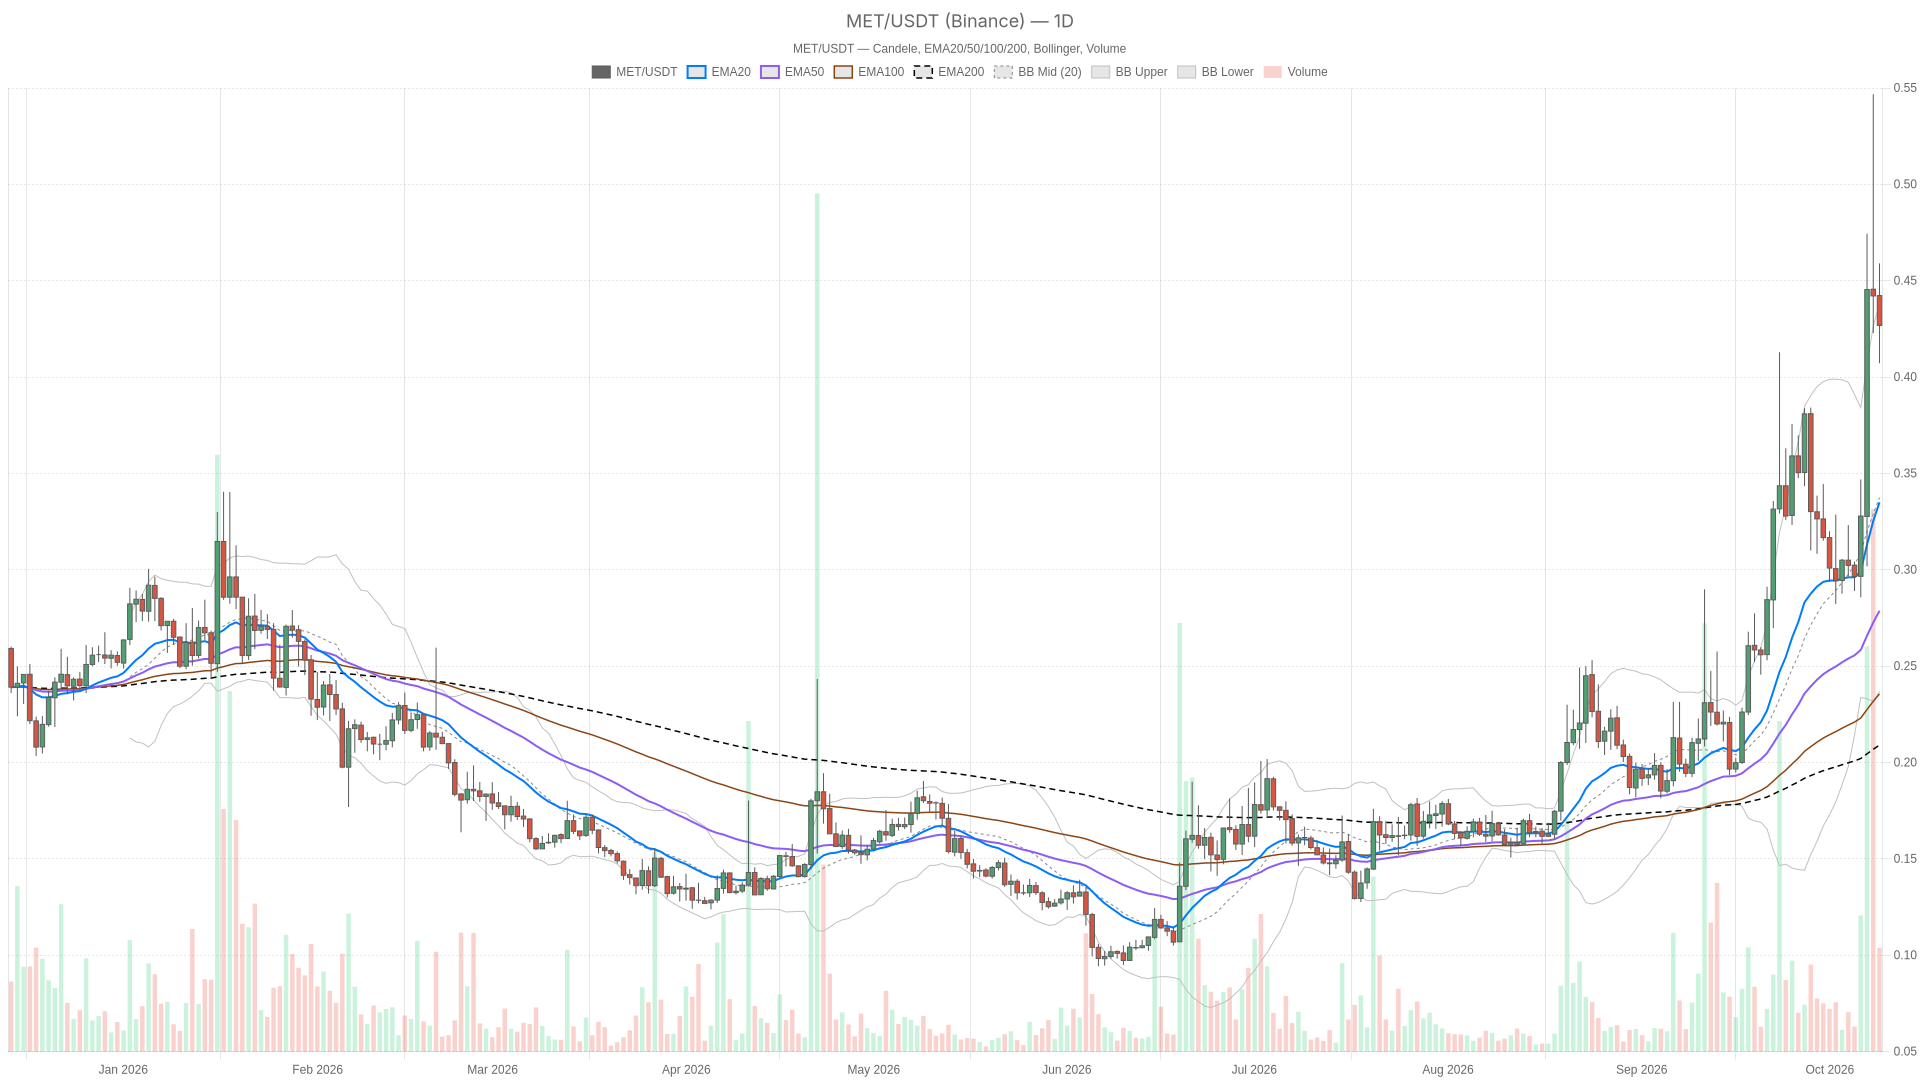
As of October 9, 2026, MET trades at $0.4268 on Binance, and the Meteora price setup remains bullish on the daily chart but unconfirmed at shorter horizons. The dominant technical force is the daily uptrend; the immediate challenge is whether price can recover hourly resistance without slipping through nearby support.
Summary
Key takeaways
- MET trades at $0.4268, below the last completed daily close of $0.4421, within a structurally bullish daily EMA alignment.
- Daily RSI at 73.8 signals overbought conditions, while the hourly MACD histogram remains negative and flat.
- An hourly close above $0.4330 is required to confirm a recovery; a close below $0.4251 would favor a deeper pullback.
- The Fear & Greed Index reads 59 (Greed), with total crypto market capitalization at $2.79 trillion and Bitcoin dominance at 59.76%.
Meteora price holds a bullish daily bias, but hourly confirmation is missing
The daily chart defines the main scenario as bullish, with price above all three EMAs and a positive MACD histogram. Yet the live daily price is below the last completed daily candle’s close of $0.4421. That gap describes a pullback within the prevailing structure, not proof that the structure has failed.
The hourly regime is neutral, with price at $0.4265. The 15-minute chart is also neutral at $0.4266, although its momentum readings are improving. In practical terms, the shortest horizon offers early recovery evidence, but the hourly chart has not confirmed it. The execution signal is therefore weaker than the daily directional bias.
Bullish EMA structure faces an extended daily trading range
On the daily chart, price is above the EMA20 at $0.3254, EMA50 at $0.2727, and EMA200 at $0.2069. These averages have a textbook bullish order. That supports the trend thesis, but their distance below price also leaves room for a substantial retracement without an immediate reversal of the EMA structure.
Hourly averages are likewise bullishly aligned, but price is below the hourly EMA20 at $0.4352 while remaining above the hourly EMA50 at $0.4212 and EMA200 at $0.3608. The weakness is concentrated in the shorter-term trend rather than across the whole hourly structure. Meanwhile, on the 15-minute chart, price is above the EMA20 at $0.4262 and EMA200 at $0.4221, but below the EMA50 at $0.4317. Those averages are not aligned, reinforcing the incomplete recovery.
The daily Bollinger upper at $0.4264 sits just below live price, while the daily Bollinger mid is $0.3290 and the lower band is $0.2316. Price is still at the stretched edge of its daily envelope. By contrast, the hourly Bollinger mid at $0.4350 is overhead, with the hourly lower band at $0.4181 and upper band at $0.4519. The daily chart is extended while the hourly chart trades below its center—a clear tension between trend strength and local mean reversion.
The 15-minute Bollinger range runs from $0.4025 to $0.4518, with its midpoint at $0.4271 slightly above price. ATR is $0.05034 daily, $0.01961 hourly, and $0.007746 on the 15-minute chart. Consequently, these volatility readings argue against treating a small intraday move as decisive confirmation.
Overbought daily RSI contrasts with negative hourly MACD
Daily RSI is 73.8, an overbought reading, but its latest completed observations are mixed rather than consistently rising or falling. Hourly RSI is 46.6 with a flat recent direction, while 15-minute RSI has risen to 50.1. The shortest chart is recovering toward balance; the hourly reading still lacks convincing bullish strength.
Daily MACD has a positive histogram that crossed above zero and is rising across the latest completed readings. That supports the bullish macro bias despite the stretched RSI. The hourly histogram remains negative with a flat recent direction, so there is no confirmed momentum improvement there. The 15-minute histogram has crossed above zero and is rising, but that is execution context—not a substitute for hourly confirmation.
Hourly R1 at $0.4330 separates recovery from another support test
The nearest hourly resistance is hourly R1 at $0.4330. Above it, the hourly Bollinger mid at $0.4350 and hourly EMA20 at $0.4352 form the next obstacles, followed by the hourly Bollinger upper at $0.4519. The daily pivot at $0.4706 and daily R1 at $0.5183 remain overhead resistance, not levels already reclaimed by MET.
Bullish scenario: an hourly close above hourly R1 at $0.4330 would confirm an initial recovery and bring those next hourly obstacles into focus. An hourly close below the hourly pivot at $0.4251 would invalidate that recovery scenario. The likeliest false signal is a brief break above hourly R1 that fails beneath the nearby hourly mid-band and EMA20.
Bearish scenario: an hourly close below the hourly pivot at $0.4251 would favor a deeper local pullback toward the hourly EMA50 at $0.4212, then the hourly Bollinger lower at $0.4181 and hourly S1 at $0.4180. An hourly close above hourly R1 at $0.4330 would invalidate that breakdown scenario. A quick dip below the pivot followed by a reclaim would be the corresponding downside trap.
The daily Bollinger upper at $0.4264 is only a thin immediate support reference. Below it, daily S1 at $0.3943 is the next listed daily support. With daily RSI overbought and ATR showing substantial movement ranges, an hourly breakdown could deepen the retracement without automatically overturning the bullish daily EMA structure.
Greed at 59 does not resolve MET’s mixed momentum
Alternative.me’s Fear & Greed Index is 59, classified as Greed. CoinGecko puts total cryptocurrency market capitalization at $2.79 trillion and Bitcoin dominance at 59.76%. These readings provide broader context, but they do not establish a catalyst for MET or resolve its disagreement between daily trend strength and hourly momentum.
FAQ
Is $0.4268 a completed daily closing price?
No. It is the live price of the open daily candle in the Binance snapshot. The last completed daily candle closed at $0.4421.
Does overbought daily RSI make the main scenario bearish?
No. Daily RSI is 73.8, but price remains above bullishly aligned daily EMAs and the daily MACD histogram is positive and rising. The reading flags extension rather than confirming a trend reversal.
Disclaimer: This article is for informational purposes only and does not constitute financial advice, an investment recommendation, or a solicitation to buy or sell any financial instrument or cryptocurrency. The analysis provided is not indicative of future results. Investing in crypto assets and financial markets carries a high risk of capital loss. Always do your own research (DYOR) and consult a qualified financial advisor before making any decision.
Article produced with the assistance of artificial intelligence and reviewed by the editorial team.