
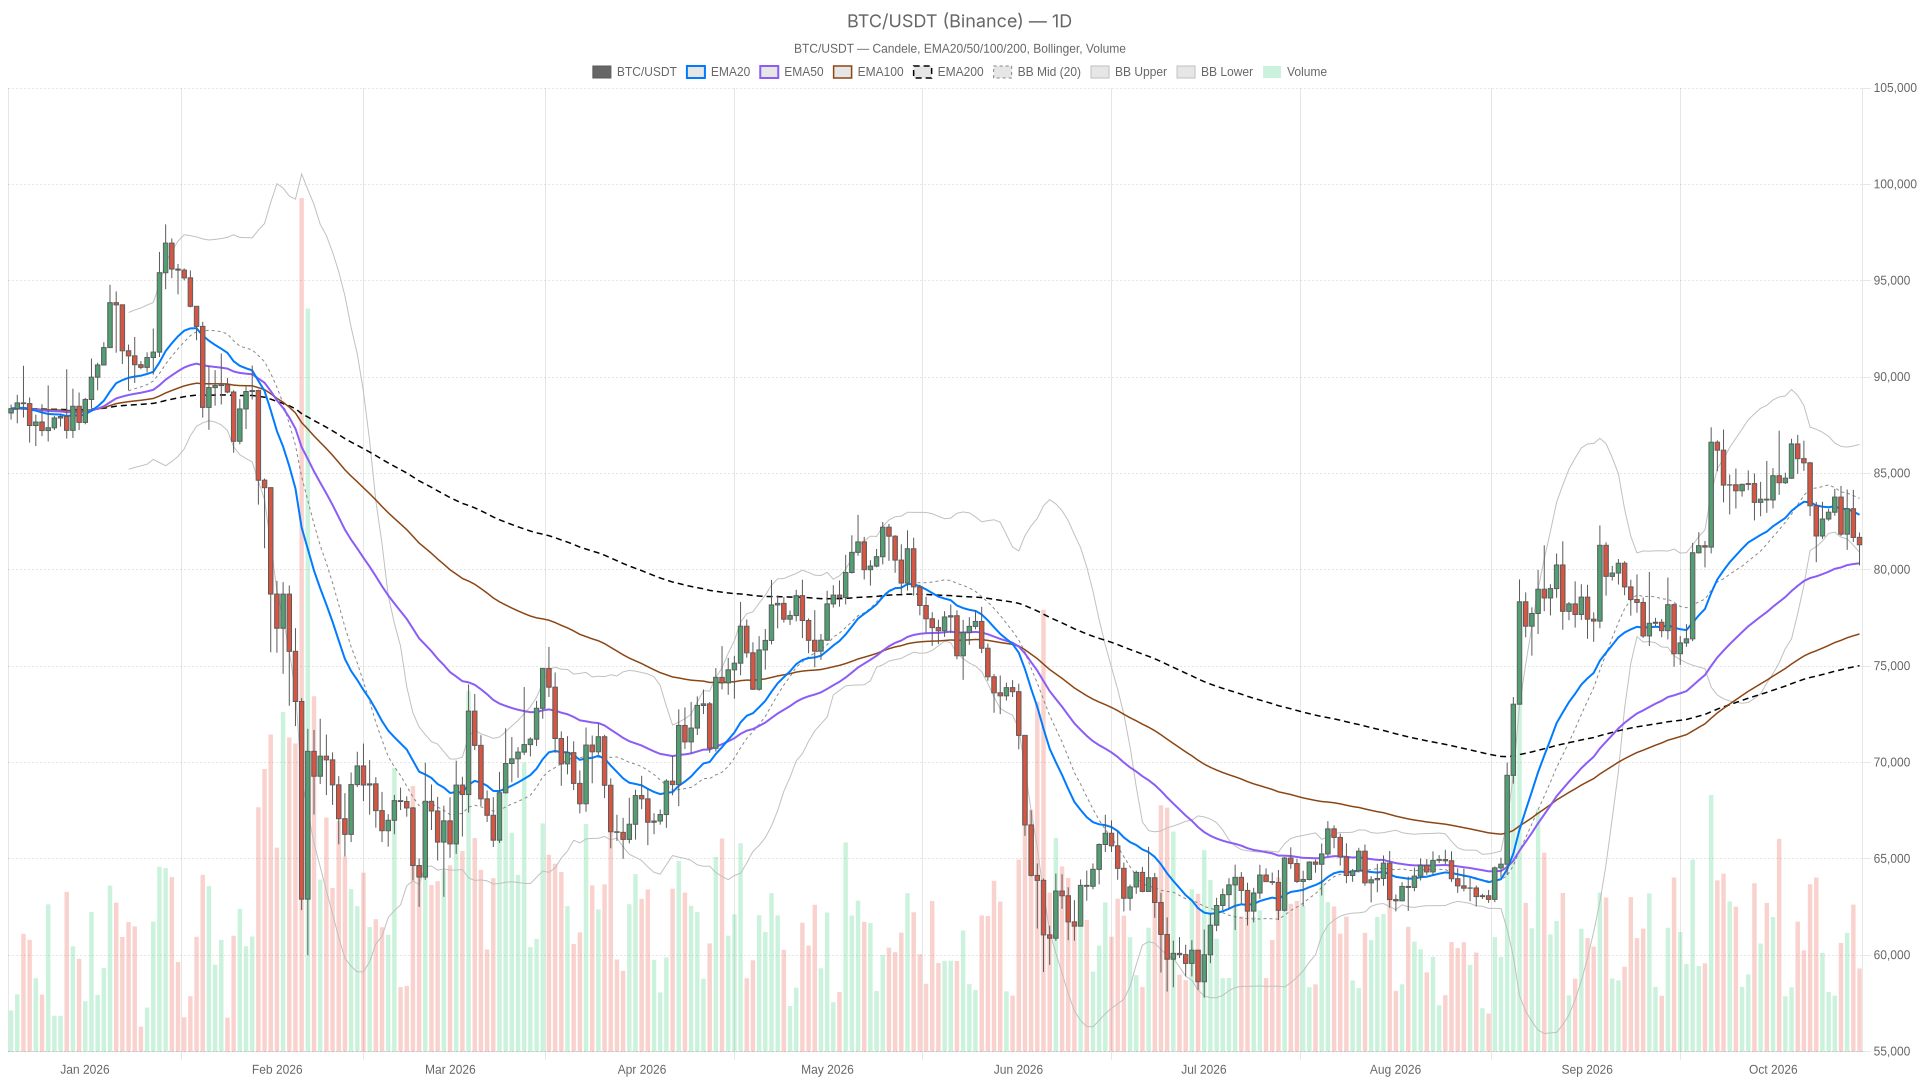
As of October 15, 2026, Bitcoin trades at $81,298.00 on Binance with a neutral daily setup. Price is below the daily 20-period EMA but above the 50- and 200-period EMAs. The contest is between a rebound from the daily lower Bollinger band and an unbroken hourly downtrend.
Summary
Key takeaways
- Bitcoin trades at $81,298.00 with a neutral daily trend, below the 20-period EMA but above the 50- and 200-period EMAs.
- An hourly close above the pivot at $81,381.96 would activate a rebound scenario targeting hourly R1 at $81,583.33.
- An hourly close below S1 at $81,178.92 would trigger a bearish continuation toward the hourly lower Bollinger band at $80,812.56.
- Daily RSI at 46.8 and a negative MACD histogram signal weak macro momentum despite improving intraday readings.
- Bitcoin ETFs shed $261 million on October 15, 2026, while the Fear & Greed Index sits at a neutral 53.
The distinction matters. Positive intraday momentum is not the same as a trend reversal, particularly when the hourly averages remain bearishly aligned. The strongest reading here is a potential mean-reversion bounce within a vulnerable short-term structure, not a confirmed return to bullish control.
Bitcoin value faces an hourly pivot test at $81,381.96
The nearest resistance is the hourly pivot at $81,381.96, with the hourly live price at $81,292.10. The last completed hourly candle closed at $81,380.29, so a close above that threshold has not yet been confirmed. Below price, the daily lower Bollinger band at $81,274.33 is the immediate daily support reference, followed by hourly S1 at $81,178.92. These are distinct levels, not a shared pivot.
Bullish scenario: an hourly close above the hourly pivot
An hourly close above $81,381.96 would activate the rebound scenario, opening a test of hourly R1 at $81,583.33. Beyond that, the hourly 20-period EMA at $81,698.12 is another resistance hurdle. This bullish scenario would be invalidated by an hourly close below hourly S1 at $81,178.92. Even a successful initial rebound would remain a local recovery; the daily pivot at $82,424.38 is the larger resistance reference.
Bearish scenario: an hourly close below hourly S1
An hourly close below $81,178.92 would activate the bearish continuation scenario, exposing the hourly lower Bollinger band at $80,812.56, followed by daily S1 at $80,702.05. An hourly close back above the hourly pivot at $81,381.96 would invalidate that breakdown scenario.
The likeliest false signal is a brief recovery above the hourly pivot that cannot clear the next resistance. Conversely, trading below the nearby daily lower band without an hourly support break would be weaker evidence of continuation. With daily ATR at $2,214.35 and hourly ATR at $597.41, these nearby thresholds sit inside substantial trading ranges; an intrabar breach alone offers less conviction than a completed candle.
Intraday momentum improves, but the daily reading remains weak
RSI favors a tentative bounce rather than a broad reversal
Daily RSI is 46.8, hourly RSI is 43.3, and 15-minute RSI is 53.7. The daily reading leaves the macro setup without strong upside momentum, while the hourly reading still leans defensive. Only the 15-minute RSI has a rising direction across the supplied completed readings. That improvement helps the execution picture, but it does not override the larger timeframes. None of these readings is overbought or oversold.
MACD shows a short-term recovery against negative daily momentum
The daily MACD histogram is negative, with a flat computed direction across the supplied readings. On the hourly chart, the histogram has risen through zero into positive territory, although the MACD line remains negative. That is evidence of improving short-term momentum, not yet a clean bullish trend.
The 15-minute histogram is also positive, but its computed direction is flat. Taken together, the signals conflict: intraday momentum supports a rebound attempt, while the daily momentum backdrop does not confirm a broader advance.
Bullish daily EMA alignment contrasts with bearish intraday structure
Binance-derived daily averages are bullishly aligned: the 20-period EMA is $83,019.21, the 50-period EMA is $80,299.06, and the 200-period EMA is $74,960.80. Price is below the daily 20-period EMA and above the daily 50- and 200-period EMAs. That combination supports the neutral daily bias: the broader structure survives, but price has lost its faster trend reference.
Hourly price is below all three EMAs, which are bearishly aligned at $81,698.12, $82,326.32, and $83,128.66 for the 20-, 50-, and 200-period averages, respectively. This is the main structural obstacle to treating the intraday momentum improvement as a reversal.
On the 15-minute chart, the supplied classification places price at the 20-period EMA of $81,244.43, below the 50-period EMA of $81,427.97 and below the 200-period EMA of $82,361.06. Those averages are also bearishly aligned. The shortest timeframe therefore offers execution context, not independent evidence of a bullish macro shift.
The daily Bollinger midpoint is $83,848.25 and the upper band is $86,422.18, while price sits near the lower band already identified as immediate support. Price is therefore near the lower edge of its daily volatility envelope. That creates room for mean reversion, but touching the lower band does not establish a floor. The 15-minute ATR of $258.06 also underscores how much short-term movement can occur without resolving the daily trend.
ETF outflows and inflation headlines fit the defensive setup
Cointelegraph reported on October 15, 2026, that Bitcoin ETFs shed $261 million. In this article’s reading, that flow headline fits the defensive hourly structure, although it does not establish what caused the current price movement.
The Block reported on October 14, 2026, that Bitcoin fell below $82,000 as hotter core CPI revived concerns about a Federal Reserve rate hike. That reported macro context provides a reason to distinguish a technical rebound from a broader improvement in risk appetite; positive intraday momentum alone does not resolve the uncertainty described in the headline.
Neutral sentiment sits alongside Bitcoin dominance of 60.02%
Alternative.me’s Fear & Greed Index is 53, classified as Neutral. Sentiment therefore does not provide an extreme reading to support either a capitulation thesis or an exuberant-market thesis.
CoinGecko places total cryptocurrency market capitalization at approximately $2.71 trillion and Bitcoin dominance at 60.02%. These are current levels, not evidence of a directional change in dominance. For BTCUSDT, they provide market context rather than confirmation of either technical scenario.
FAQ
Is Bitcoin’s main daily scenario bullish or bearish?
The main daily scenario is neutral. Price is below the daily 20-period EMA but remains above the daily 50- and 200-period EMAs, while daily RSI is 46.8 and the MACD histogram is negative.
Has the hourly bullish trigger already been confirmed?
No. The last completed hourly candle closed at $81,380.29, below the hourly pivot at $81,381.96. The rebound scenario requires an hourly close above that pivot and would be invalidated by an hourly close below hourly S1 at $81,178.92.
Disclaimer: This article is for informational purposes only and does not constitute financial advice, an investment recommendation, or a solicitation to buy or sell any financial instrument or cryptocurrency. The analysis provided is not indicative of future results. Investing in crypto assets and financial markets carries a high risk of capital loss. Always do your own research (DYOR) and consult a qualified financial advisor before making any decision.
Article produced with the assistance of artificial intelligence and reviewed by the editorial team.