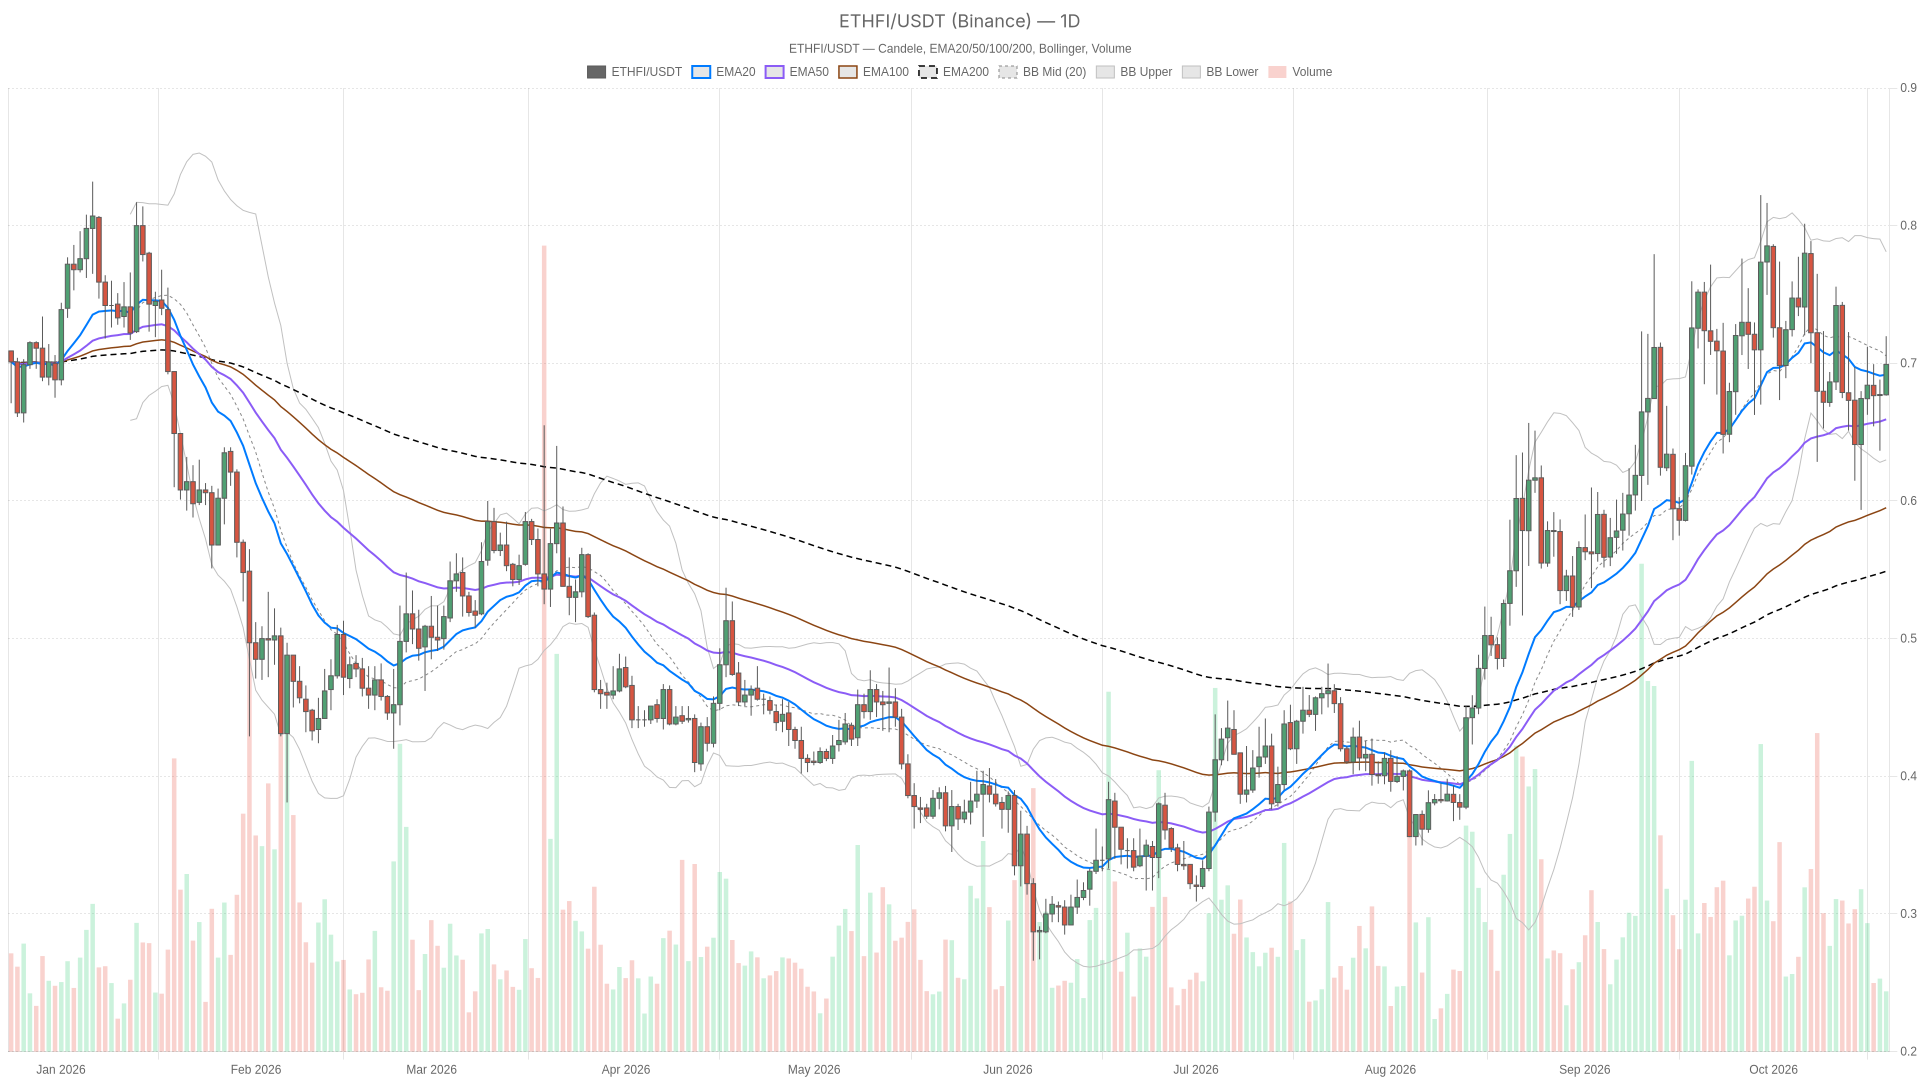
As of October 19, 2026, the EtherFi price retains a bullish daily bias, but its short-term momentum is weakening. The ETHFI/USDT daily snapshot places the live price at $0.6992, above all three daily EMAs and just above daily R1. This is a constructive trend structure, not yet a convincing breakout.
Summary
Key takeaways
- ETHFI trades at $0.6992, above bullishly stacked daily EMAs but with neutral daily RSI at 48.5.
- A daily close above the Bollinger midpoint at $0.7092 is needed for a stronger bullish signal; below daily R1 at $0.6982 would weaken the setup.
- The Fear & Greed Index readings conflict (59, Greed, and 44, Fear), yet total crypto market cap is down 2.04% over 24 hours, limiting confidence in a broad risk-on move.
- Hourly momentum is fading: hourly RSI has fallen to 62.5 while the hourly MACD histogram is narrowing, undermining immediate continuation.
- The October 16 resistance test provides context but no new catalyst for the current move.
Daily strength in the EtherFi price lacks hourly confirmation
The daily EMA structure is bullish, yet the last completed daily candle closed at $0.6773, below the current live price. The recovery therefore remains part of an unfinished daily candle. That distinction matters: the live move has improved price positioning without establishing a completed daily breakout.
The hourly snapshot is at $0.6994, versus a last completed hourly close of $0.7029. Its regime is neutral, and the 15-minute chart is also neutral. Those shorter horizons weaken the immediate continuation case without overturning the daily bullish bias. The 15-minute chart is useful here for execution context, not for redefining the broader trend.
Aligned daily averages provide structure, but volatility leaves room for whipsaws
Price is above the daily EMA20 at $0.6910, EMA50 at $0.6577 and EMA200 at $0.5474. Those averages are stacked bullishly. The structure favors a bullish baseline, although the distance between the longer-term averages and price does not establish immediate buying momentum.
On the hourly chart, price is above the EMA20 at $0.6880, EMA50 at $0.6788 and EMA200 at $0.6832, but the averages are not aligned. That is a less convincing trend foundation than the daily arrangement. On the 15-minute chart, price is below the EMA20 at $0.7058 but above the EMA50 at $0.6951 and EMA200 at $0.6809; the averages themselves remain bullishly stacked. The immediate pullback has disrupted the fastest trend reference without breaking the slower structure.
The daily Bollinger midpoint at $0.7092 is overhead resistance, with the daily upper band at $0.7903 and lower band at $0.6281. Trading below the midpoint tempers the bullish EMA reading: price has not reclaimed the center of its daily volatility envelope. The hourly Bollinger midpoint at $0.6770 lies below price, giving the shorter chart a more constructive position within its own envelope.
ATR is $0.06758 on the daily chart, $0.010865 hourly and $0.004811 on the 15-minute chart. These ranges put the tightly spaced nearby levels in perspective: crossing one intraday is weaker evidence than sustaining a completed close beyond it. The main risk is a brief breakout that reverses before the broader structure confirms.
RSI retreats on shorter charts while daily MACD pressure eases
Daily RSI is 48.5, a neutral reading that offers little confirmation of the bullish moving-average structure. Hourly RSI has fallen to 62.5, while 15-minute RSI has fallen to 48.8. Momentum remains constructive hourly but is weakening, and the execution chart has no clear directional advantage.
The daily MACD histogram is negative but narrowing toward zero. Bearish momentum is easing, rather than bullish momentum being established. The hourly histogram remains positive but is falling and narrowing, showing that its positive impulse is fading. The 15-minute histogram is negative. Together, these readings explain the conflict: the daily chart is improving beneath the surface just as shorter-term momentum becomes less supportive.
Daily R1 at $0.6982 separates a recovery attempt from a deeper pullback
The EtherFi price is already above daily R1 at $0.6982, making that level nearby support rather than pending resistance. Overhead, hourly S1 at $0.7013 is resistance despite its label, followed by the hourly pivot at $0.7045 and hourly R1 at $0.7060. The last completed hourly candle was already above hourly S1, so merely crossing that level again would not establish a fresh confirmation.
Bullish scenario: an hourly close above the hourly pivot at $0.7045 would confirm a stronger recovery attempt, bringing hourly R1 at $0.7060 and the daily Bollinger midpoint at $0.7092 into focus. An hourly close back below hourly S1 at $0.7013 would invalidate that breakout setup. The likeliest false signal is a brief move through the hourly pivot while hourly momentum continues to fade.
Bearish scenario: an hourly close below daily R1 at $0.6982 would confirm the loss of the nearest daily support, exposing the daily EMA20 at $0.6910 and hourly EMA20 at $0.6880. An hourly close above hourly S1 at $0.7013 would invalidate that breakdown setup. A deeper failure would put the daily pivot at $0.6673 in view, but that is not the immediate target. The principal bearish trap is a short-lived break below daily R1 while the daily EMA structure remains intact.
The October 16 resistance test provides technical context
The October 16, 2026 update focused on ETHFI testing resistance. That context supports keeping the present analysis centered on breakout confirmation; it does not establish a new fundamental catalyst for the current move.
Conflicting sentiment readings sit against a weaker broader market
The Fear & Greed Index has conflicting readings: 59, classified as Greed, in one data set and 44, classified as Fear, in another. Total cryptocurrency market capitalization is $2,757,071,071,976.57, down 2.04% over 24 hours, with Bitcoin dominance at 60.20%. Sentiment and market performance are not clearly aligned: with conflicting index readings, the appetite implied by sentiment is not confirmed by the broader market’s daily change. That backdrop limits confidence in treating ETHFI’s constructive daily structure as a broad risk-on signal.
FAQ
Is ETHFI’s main scenario bullish or bearish?
The daily bias is bullish because price is above bullishly aligned daily EMAs. Neutral daily RSI and a still-negative daily MACD histogram make that a conditional bias, not a confirmed momentum breakout.
Why is hourly S1 acting as resistance?
Hourly S1 is above the current live price. Its location relative to price determines its immediate role, regardless of the support label used in the pivot calculation.
Disclaimer: This article is for informational purposes only and does not constitute financial advice, an investment recommendation, or a solicitation to buy or sell any financial instrument or cryptocurrency. The analysis provided is not indicative of future results. Investing in crypto assets and financial markets carries a high risk of capital loss. Always do your own research (DYOR) and consult a qualified financial advisor before making any decision.
Article produced with the assistance of artificial intelligence and reviewed by the editorial team.