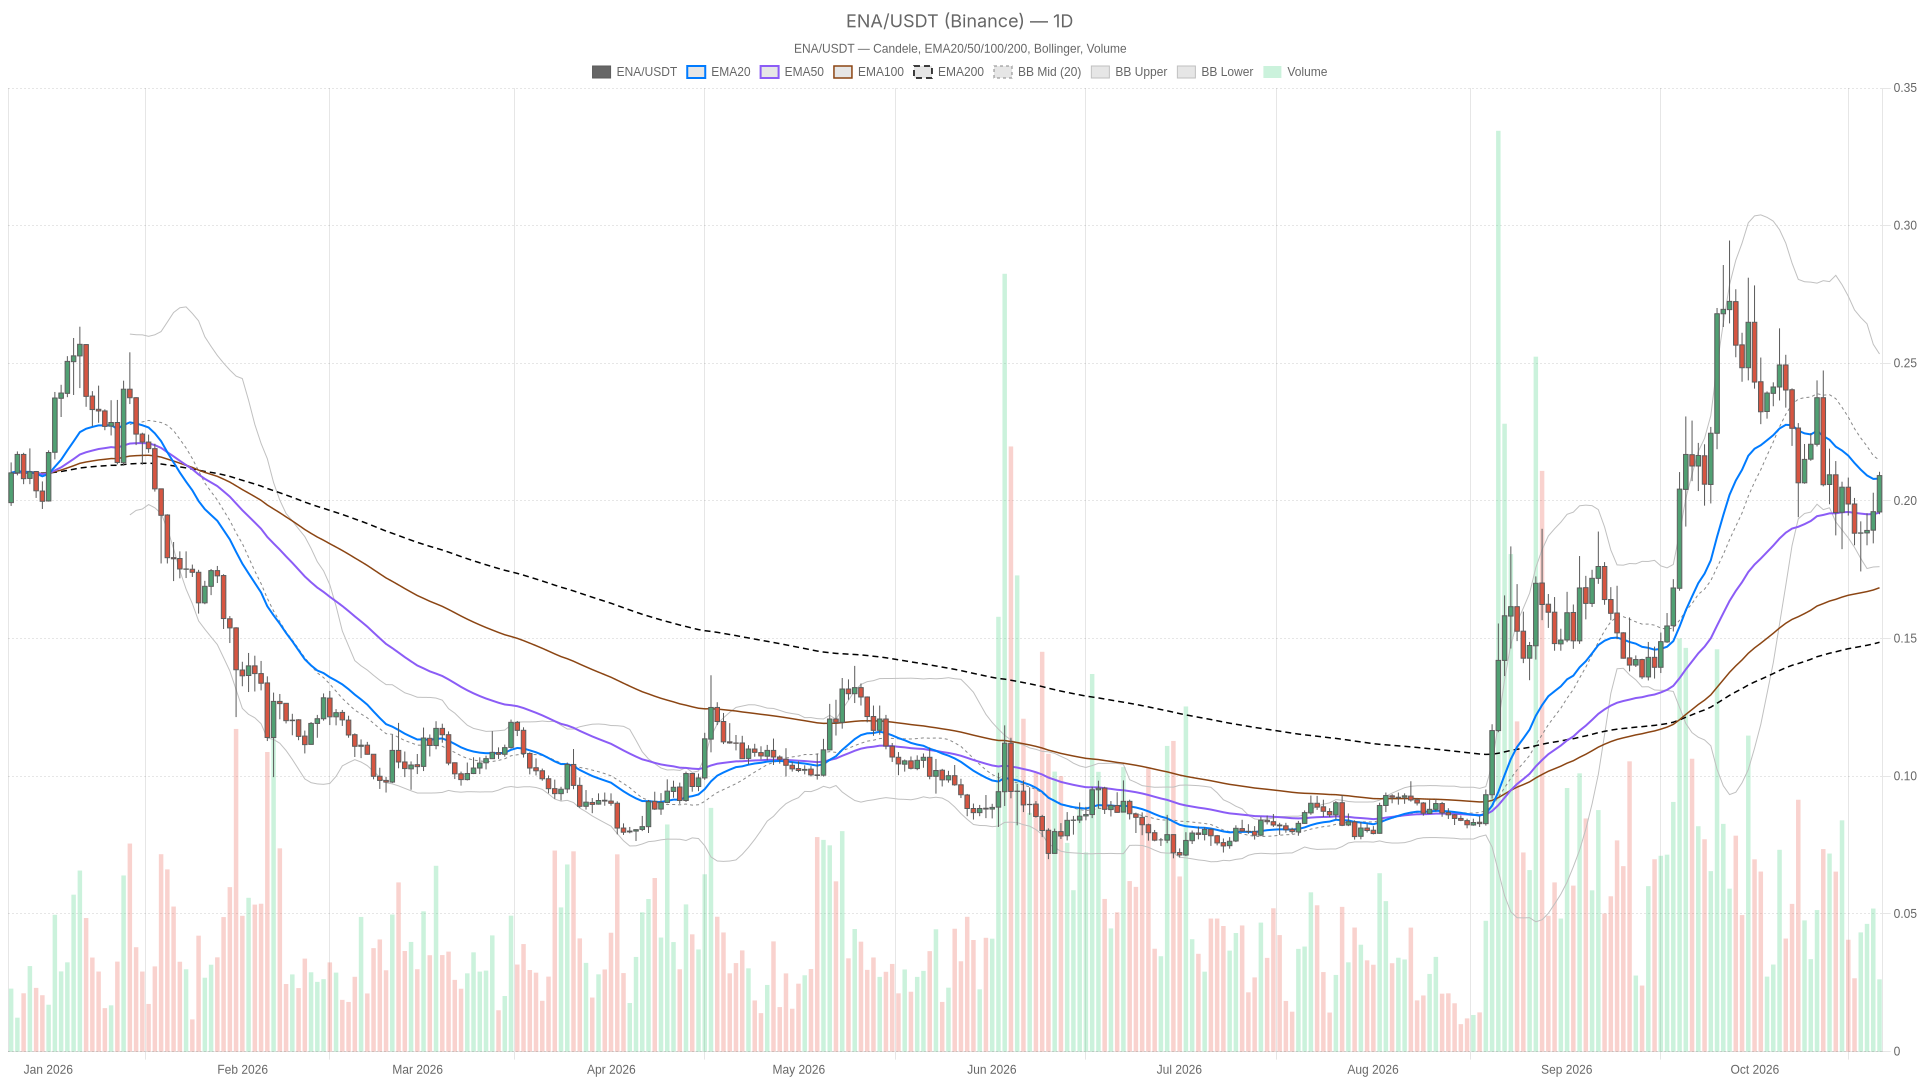
As of October 21, 2026, ENA trades at $0.2092 on Binance, and the Ethena price setup carries a cautiously bullish daily bias rather than a confirmed momentum breakout. Price is above all three daily moving averages, but daily momentum remains weaker than the hourly rally.
Summary
Key takeaways
- ENA trades at $0.2092 on Binance, above all three daily moving averages but still lacking a confirmed daily breakout.
- The hourly RSI has reached 73.5, signalling an overbought condition that contrasts with the weaker daily momentum reading of 45.4.
- A bullish continuation trigger requires an hourly close above $0.2114; failure to hold the hourly pivot at $0.2088 would open a pullback scenario.
- The Fear & Greed readings conflict, at 63 (Greed) and 48 (Neutral), while total crypto market cap sits at $2.81 trillion, offering a mixed sentiment backdrop.
- The daily MACD histogram remains negative but narrowing, indicating weakening bearish momentum rather than fully established bullish control.
Ethena price recovery exposes a gap between daily and hourly conviction
The daily chart supports the bullish main scenario through its moving-average structure, not through outright momentum strength. The hourly chart offers stronger immediate momentum, yet its neutral regime classification and unaligned averages make that confirmation incomplete. A forceful rally is not the same thing as a fully repaired trend.
The 15-minute chart belongs in the execution picture rather than the macro verdict. Its bullish structure remains intact, while momentum is easing. That combination leaves room for a pause without automatically overturning the daily bullish bias.
Bullish averages meet a stretched hourly price
On the daily chart, ENA is above the EMA20 at $0.2080, EMA50 at $0.1952 and EMA200 at $0.1481. Those averages are stacked bullishly. This gives the recovery a constructive structural foundation, although the nearest average leaves little room before that first support is tested.
Hourly price is also above its EMA20, EMA50 and EMA200, but the averages are not aligned. The 15-minute price is above all three averages with a bullish ordering. The contrast is important: short-term price strength is clear, yet the hourly trend structure has not fully caught up.
The daily Bollinger midpoint at $0.2165 remains overhead, between the lower band at $0.1760 and upper band at $0.2569. Remaining below that midpoint makes the advance look more like a recovery toward the center of the daily range than an established upside expansion. Meanwhile, hourly price is above its Bollinger upper band at $0.2078, while the 15-minute price remains below its own upper band at $0.2103. The stretch is therefore most evident on the hourly chart.
Daily ATR is $0.02102, compared with $0.003817 hourly and $0.001879 on the 15-minute chart. These readings describe substantial movement relative to the nearby technical levels; a brief crossing of a level would be less convincing than a completed candle holding beyond it.
RSI shows hourly excess while daily MACD remains negative
Daily RSI is rising at 45.4, still below the midpoint. Hourly RSI has risen to an overbought 73.5, whereas 15-minute RSI is falling at 66.5. This is the central momentum conflict: the daily recovery lacks full strength, the hourly advance is stretched, and the shortest horizon is cooling. None of those readings alone establishes a reversal.
MACD reinforces that split. The daily histogram remains negative but is narrowing toward zero, indicating that bearish momentum is weakening rather than that bullish momentum has already taken control. The hourly histogram is positive and widening, supporting the rally. On the 15-minute chart, the positive histogram is narrowing, pointing to fading upside momentum at the execution horizon.
Hourly resistance defines continuation; the pivot tests the pullback
The nearest upside barrier is hourly R1 at $0.2114. Below price, the hourly pivot at $0.2088 is the first reference, followed by daily EMA20 at $0.2080, the hourly Bollinger upper band at $0.2078 and hourly S1 at $0.2071. These are separate levels, not a single shared support.
Price is already above daily R1 at $0.2045, making that level potential support rather than overhead resistance. The daily pivot at $0.1946 sits deeper in the structure. For the Ethena price recovery, this separates an ordinary short-term retracement from a more consequential loss of daily ground.
Bullish scenario: an hourly close above hourly R1 at $0.2114 would confirm a fresh continuation trigger and put the daily Bollinger midpoint at $0.2165 in focus. An hourly close below the hourly pivot at $0.2088 would invalidate that breakout setup. The likeliest false positive is an intrahour push through resistance that fails to hold, given overbought hourly RSI and softer 15-minute momentum.
Bearish scenario: an hourly close below the hourly pivot at $0.2088 would trigger a pullback scenario toward daily EMA20 at $0.2080 and the lower hourly supports. An hourly close above hourly R1 at $0.2114 would invalidate that bearish setup. The main false signal would be a brief pivot break that recovers before the candle closes; the bullish daily average structure argues against treating every dip as a larger reversal.
Sentiment readings contrast with a softer total crypto market
The Fear & Greed Index readings conflict: one reports 63, classified as Greed, while another reports 48, classified as Neutral, with no shared reference date given. That provides a risk-appetite backdrop, not evidence of ENA-specific demand.
CoinGecko puts total crypto market capitalization at $2.81 trillion, down 0.26% over 24 hours, with Bitcoin dominance at 59.57%. The combination is mixed: sentiment is constructive, but the broader market-cap change does not provide clean confirmation of ENA’s upside recovery.
FAQ
Is the daily outlook bullish despite weak momentum?
Yes, cautiously. The bullish assessment rests on price above the daily averages and their bullish ordering; the negative daily MACD histogram prevents a stronger momentum verdict.
Does an overbought hourly RSI confirm a reversal?
No. It flags a stretched advance, while the positive, widening hourly MACD histogram still supports upside momentum. The bearish scenario requires the specified hourly pivot breakdown rather than RSI alone.
Disclaimer: This article is for informational purposes only and does not constitute financial advice, an investment recommendation, or a solicitation to buy or sell any financial instrument or cryptocurrency. The analysis provided is not indicative of future results. Investing in crypto assets and financial markets carries a high risk of capital loss. Always do your own research (DYOR) and consult a qualified financial advisor before making any decision.
Article produced with the assistance of artificial intelligence and reviewed by the editorial team.