


The bitcoin volatility index in the last 10 years has made giant strides, especially when we consider the potential of BTC to become a global payment method.
On the eve of Halloween night ten years ago, on October 31st, 2008, an unknown gentleman named Satoshi Nakamoto published a whitepaper online entitled “Bitcoin: a peer-to-peer electronic payment system”.
Today, 10 years later, the identity of the inventor is still unknown, and probably will be forever, but we know much more about bitcoin and the term cryptocurrency has now entered the common jargon.
If in recent months the perception of people against bitcoin, as well as the rest of cryptocurrencies, was affected by the high volatility of prices, today this risk seems to have vanished.
For the third month in a row, the sector is experiencing a lower closure and volatility has fallen to 1.5% on a daily basis.
If we consider that throughout the first quarter of this year the daily average bitcoin volatility index was above 5%, we must note that the current market is quite different from what we were used to a few weeks ago and begins to lack the adrenaline accumulated in the ups and downs of recent months.
The reasons for this market transformation are not fully understood. In a recent interview with Bloomberg, David Tawil – co-founder and president of Maglan Capital, a New York hedge fund that manages over $15 billion – said that “bitcoin’s muted volatility is a result of maturity within the asset class and a gained comfort of valuation — not so much a lack of interest from market participants. There is a lot of development going on, relating to infrastructure and direct investment,” continued Tawil, “The fruits of those labors will begin to manifest soon“.
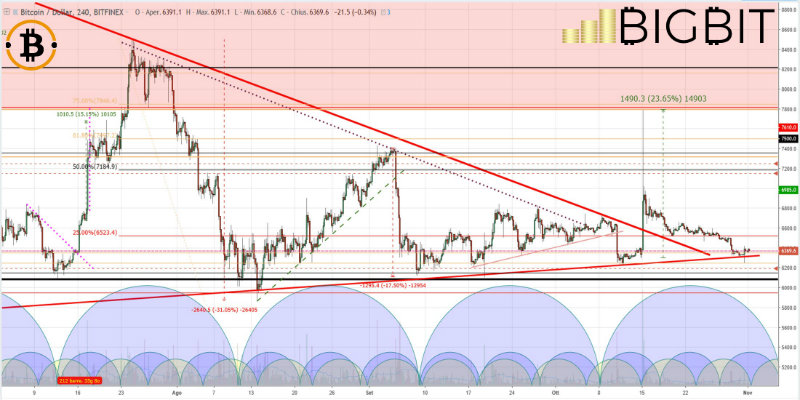
Bitcoin (BTC)
Prices continue to remain below the threshold of 6400 dollars, a condition not favourable to bulls who prefer to remain marginalized. The monthly trend can be defined as both lateral and bearish, but certainly not bullish.
To get some positive signals the recovery of 6750-6800 dollars is needed. While sinking below $6200 and $6000 would again sound the alarm of an imminent attack by the bears.
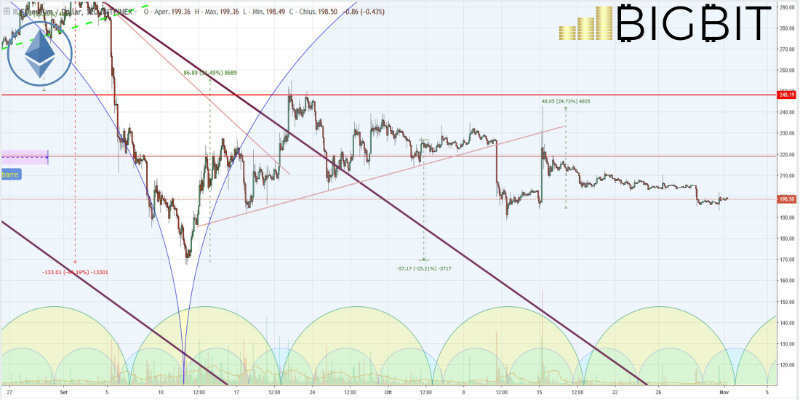
Ethereum (ETH)
At a distance of 24 hours, it becomes difficult to find the differences with yesterday’s graph. The chart of the last hours has recorded a small movement yesterday afternoon, with prices that from 194 dollars have tried reaching 201 dollars.
But it only took a few minutes to nullify the rise, and this morning prices are at the same level as yesterday, just below the technical and psychological area of $200.
