Today Bitcoin does not record particular shocks: in fact, according to the analysis, the volatility in the last 3 days marks half of the average of the last 30 days. The current volatility rate is at about 3%, while the 30-day volatility is at around 7%.

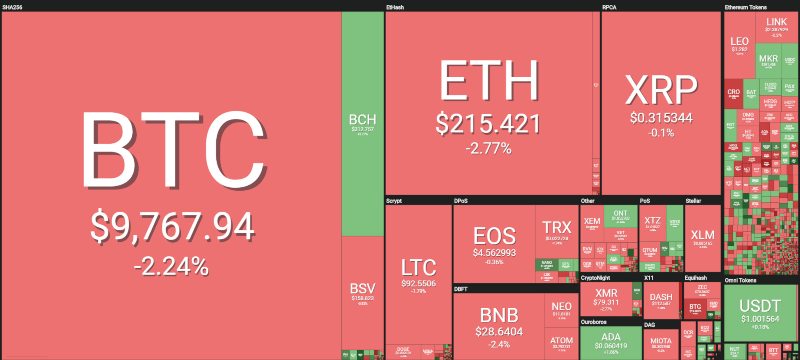
Today, more than 60% of cryptocurrencies travel in negative territory. Among the top 20, there are no positive signs. Of all, those who lose the most ground are Bitcoin Satoshi Vision (BSV), which marks – 6%, followed by TRON (TRX) which continues to maintain a bearish pace with an overall movement that from the highs of late June sees a loss of more than 45%.
The red sign also prevails on a weekly basis. In fact, taking as a reference the values of last Friday, bitcoin loses 5%, Ethereum oscillates around the parity, while Ripple is slightly positive, a sign that should not mislead because, with the downtrend that characterised the bearish movement since May 23rd and that ended on July 16th, XRP has lost 45% of the value. In any case, the return of prices to 30 cents, values that had characterised Ripple for the first 5 months of 2019, is worth noting.
The week is also negative for litecoin, although LTC has tried to recover the $100 and has stood out for its relative strength.
Total capitalisation remains close to $270 billion: despite the difficulties, it seems that it does not want to fall below $250 billion, the minimum levels reached last week and which are a bit the centre of gravity of this last period in terms of total capitalisation levels.
Bitcoin dominance continues to decline slowly: today it is 64.5%, showing how bitcoin is losing ground to the other altcoins in the recent descent of the last few days. By mid-July, bitcoin had again reached the threshold of 67%, so 64.5% of today remains close to that level.

Bitcoin (BTC)
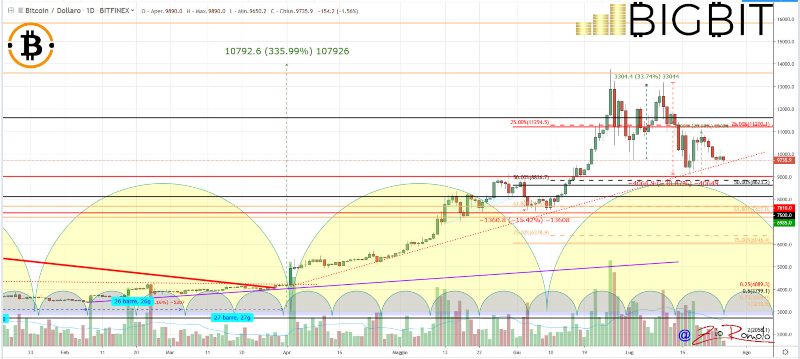
Prices have fallen back below $9,800. Volatility, however, remains low. The $10,000 area has been the centre of gravity for the last 10 days. For BTC it is important not to go below the threshold of 9,500 dollars where the dynamic trendline that connects the lows of last April passes. To see bullish signals that may bring new purchases, bitcoin must reach $11,000.
It is important not to forget that the technical structure of bitcoin is in the final phase of the bi-monthly cycle that began in early June and that it could close within three weeks.

Ethereum (ETH)
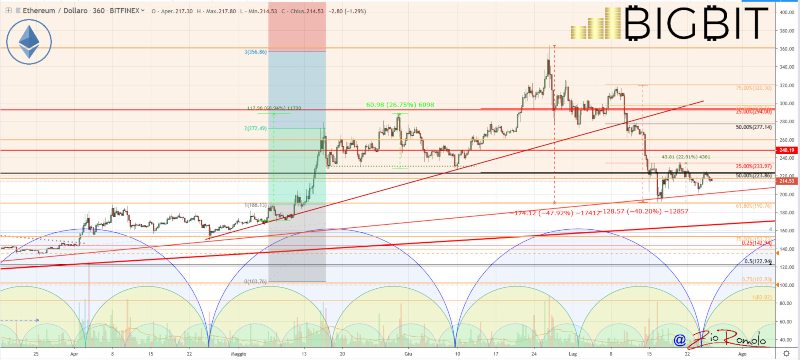
Ethereum remains caged in the fluctuations between 210-225 dollars without giving particular useful indications at the operational level. Ethereum is in the final phase of the two-month cycle. The hypothesis leads to a temporal configuration with early closure compared to bitcoin.
For Ethereum it is necessary to go back over the $235 area, level of support that had pushed every bearish attack in June and that was reviewed around July 20th. However, without purchases, this has become a level of resistance in the medium term.
For Ethereum it is necessary to go over 235 dollars and recover the 255-260 dollars in the next days or weeks.


