Among all the cryptocurrencies, today’s analysis highlights the price of bitcoin (BTC) which, after the excellent rise of two days ago, continues its upward trend, scoring +5%. In these hours, BTC is trying to conquer 10,500 dollars mark, a level that was touched yesterday evening, in conjunction with the collapse of the US stock market, which continues to be affected by the decisions of the Fed and the tweets of Trump.
BTC’s price movement yesterday occurred in the hours following the US President’s tweet that announced increased duties on goods from China, coming into effect on September 1st.
Bitcoin, therefore, shows that it is no longer theoretically a crypto of refuge, but also a store of value. This is reflected by BTC with the best rise of day in the top 10.
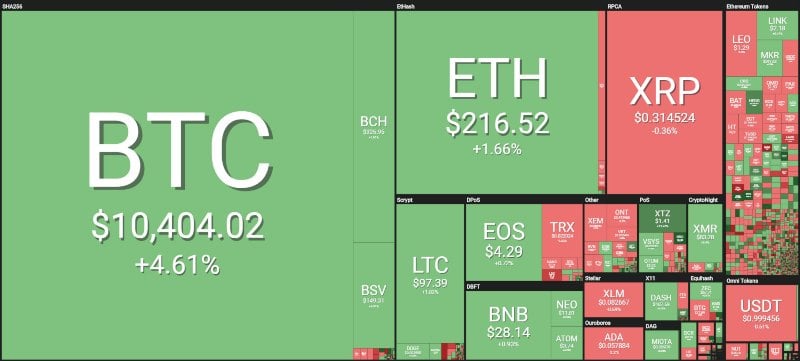
n order to find a better rise, it is necessary to go down in the ranking where there is Tezos (XTZ) that, similarly to yesterday, returns to run upwards returning to above 1.42 dollars with a rise of 11%. Tezos now capitalises 930 million dollars, occupying the 11th position in the ranking.
Among the best, there are two other double-digit increases: the unknown 1irstcoin (FST), with a rise that pushes it to 9 dollars, and thanks to a +14%, reaches the top 100 in 99th position. The other double-digit rise is by Energi (NRG), which rose by +14%.
Among the worst, there is Lambda (LAMB), which fell by 8%. Nexo (NEXO) also performed negatively.
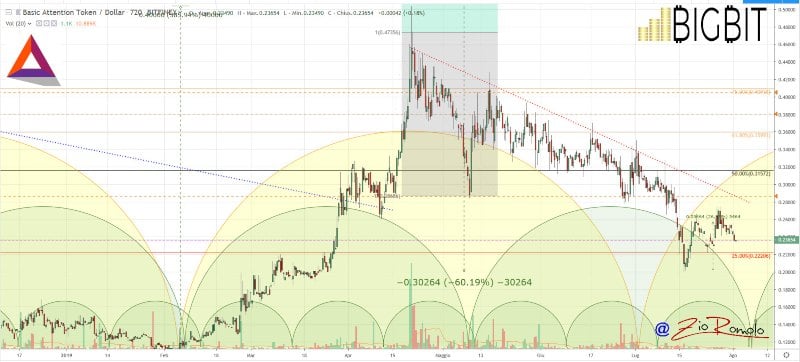
Basic Attention Token (BAT) has announced the implementation of its reward now valid also for Twitter users. This has no particular impact on the price of BAT which, on the other hand, has continued to fall in the last few hours, with a drop of -3% and a value of $0.23.
The same is true for Litecoin: after yesterday’s leap that saw the price of LTC for a few minutes just over 100 dollars, today Litecoin suffers a downturn just below this threshold. It would be a very important psychological indication for Litecoin to reach the halving of the next hours with prices above 100 dollars.
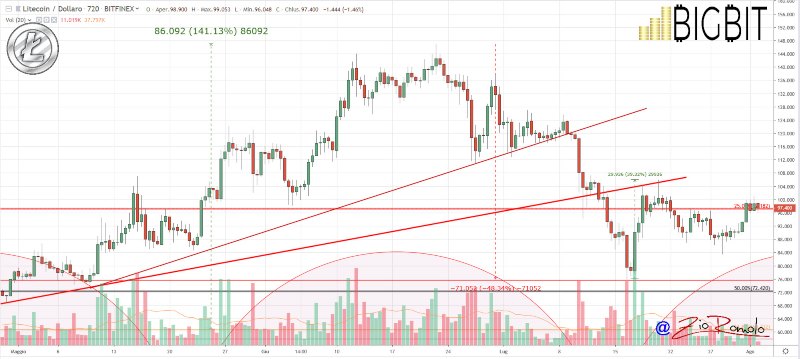
Litecoin gains a little less than 1%, keeping the 4th position in the ranking, about 400 million dollars away from the 5th crypto in the ranking, Bitcoin Cash. BCH yesterday celebrated its second year of life and today gains 1%, but continues to remain close to the tough resistance of 335 dollars, a level tested yesterday and then rejected by sales. Today Bitcoin Cash is at $325.
The general situation continues to remain unchanged for the whole sector. Only the price of bitcoin shows clear signs of wanting to change the trend of the month of July that was characterised by a negative trend. From the lows of July 29th, the price of BTC shows one of the best upward performances, rising 15% from the values of the end of the month.
This is a signal that benefits the market capitalisation which rises to 282 billion dollars, the highest peak of the last seven days. Bitcoin climbs to 66% dominance, a step away from last year’s record reached in mid-July with the peak which saw 67% dominance for the first time since April 2017.
This dominance weakens both Ethereum and Ripple: ethereum falls again at one step from the 8% threshold, while Ripple, after abandoning the 5% threshold, is now at 4.8%.
The last 48 hours have been characterised by a higher trading volume compared to the last week, confirming how the last 48 hours have been marked by movements particularly driven by bitcoin trading.
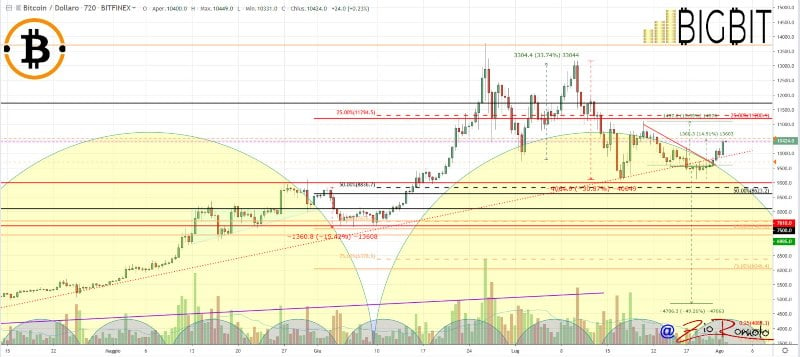
Bitcoin (BTC) price analysis
The price of bitcoin goes to test the threshold of 10,500 dollars, an increase that brings the prices to the levels of July 22nd, recovering all the decline of the last 10 days. This suggests an interruption of the bi-monthly cycle with an anticipated closing. As already pointed out, the natural closure of the current two-month cycle is expected in mid-August, but at the moment there are no signs of weakness. On the contrary, BTC proves to be the most energetic cryptocurrency of the last week.
At this point, it is necessary for bitcoin to go beyond 10,500 and go and test 10,900-11,000 dollars, the bulwark of the support violated with the downward movement of mid-July, ended with the recent low of July 29th.
The current short-term bullish trend on a weekly basis would only be affected with a return of prices in the 9,800 area over the weekend.
Ethereum (ETH) price analysis
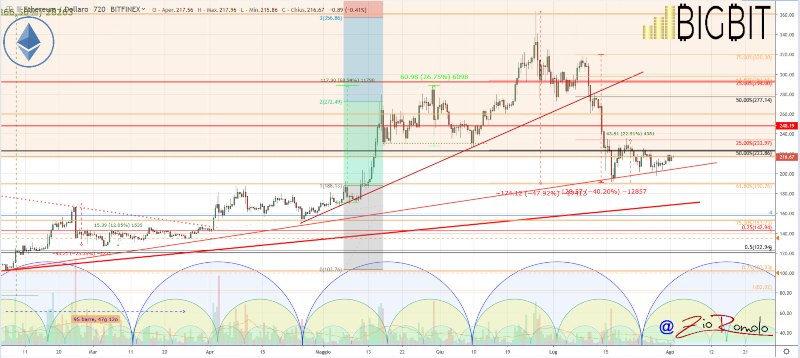
The situation of Ethereum remains unchanged. Prices continue to fluctuate around the $215 area without any weekly operational indication. For Ethereum, it is necessary to take back $225 and then push over the resistance of the last two weeks at $235. Without similar confirmations, the movement remains in this congestion and does not give useful signals from an operational point of view.
For Ethereum it is important not to go under the 205-200 dollars area to avoid damaging the bullish trend that began in early February and that at this time continues to confirm the upward trend.


