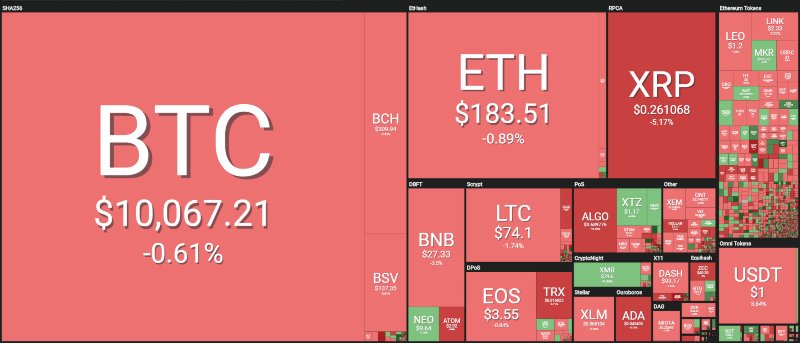
With the movements of mid-August, Ethereum, Ripple and Litecoin saw a price drop with bearish movements exceeding 20%, pushing below the support of mid-July.

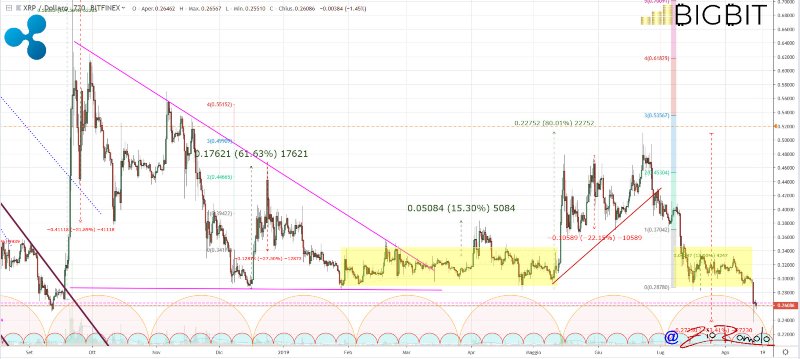
Among them, there’s the price drop of Ripple in particular: with yesterday’s movement, XRP returned below 24 cents of dollars, levels that had not been recorded since November 2017.
It’s a dangerous and decidedly delicate situation for the Ripple price, breaking through the side channel that since last December 2018 had rejected any bearish attack on the threshold of 28 cents of a dollar. The rupture that took place with strong selling volumes between Wednesday and Thursday shattered the support, pushing prices to lows of the last 20 months.
Amidst the sunshine and holidays, yesterday saw a dangerous dive of the cryptocurrency sector that only in the evening, thanks to an upward move in the afternoon, allowed not closing with a negative balance for the fourth consecutive day.
This is an event that occurred only twice in 2019: precisely in mid-July and in the first days of January that featured 4 consecutive days in negative, but in terms of intensity, the sum of the falls did not go beyond 12%.
With yesterday morning’s downturn, the downward trend that began on Monday, August 12th, marks a loss of more than 20% for bitcoin, which recovered a handful of points thanks to the pullback that began in the last 12 hours. Bitcoin is the one showing the best resilience to the bearish movement, unlike Ethereum, Ripple and Litecoin which have recorded deeper sinkings.
Moreover, yesterday’s sinking caused a loss of over 30 billion euros of the total capitalisation in a single day and only the pullback of the second part of yesterday brought the values back to test the short-term resistance.
The strong bearish movement was accompanied by volumes rising again to over 85 billion dollars traded during the day.

The day sees positive signs returning again, but it is a signal that should not be misleading: at the moment these are green signs due to the rebound in progress, which will have to be confirmed in the coming days.
Being a week characterised by holiday volumes, it will be interesting to understand whether the drop has found a bottom, the lowest point, or whether what is happening today, with a prevalence of green signs, will be a small rebound signal due to the coverage of the downward positions.
The total capitalisation today returns slightly above 260 billion dollars. The dominance of bitcoin remains over 68.5%. This confirms how, despite the decidedly bearish phase of recent days due to a general context, bitcoin is confirmed as a safe haven crypto.
Today, Bitcoin is the only one among the top 10 cryptocurrencies for market cap to keep a positive balance since August 1st, alongside Binance Coin (BNB).

Bitcoin (BTC) price
After the dropping to $9,500, bitcoin yesterday managed to bounce back to the $10,200 area, a level that was previously a level of dynamic support and that until yesterday has maintained the uptrend since the beginning of April.
In this context, the short-term phase remains decidedly bearish. If we look at what has happened since last June, the support of the 9,500 has proved to be a difficult area in the last month.
A possible sinking over the weekend would cause a return of downward speculation and a possible test of the next support identified in the $8,800 area. In the bullish phase, the medium-term resistance is 15% distant, identifiable in the $12,000 area.

Ethereum (ETH) price
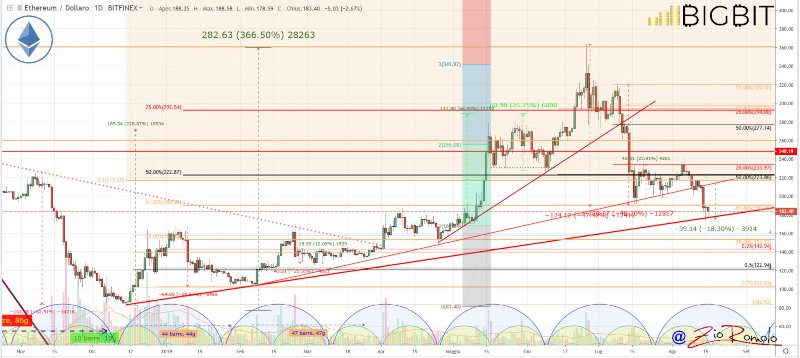
The downward movement leads Ethereum to test the dynamic trendline present since last mid-December and which highlights the still valid bullish trend.
A possible break of 175 dollars in the next few days would cause a downward movement that would see the next support in the $155 area. Below this level, the medium-long term bullish trend would begin to be compromised.
In the next few days, Ethereum needs to recover the psychological area of $200 and, once a valid basis for support has been laid, it will be important to recover $225-230. But before evaluating the resistance it is necessary for ETH to find the support of the dynamic trendline above 185 dollars. Without this confirmation, Ethereum could go on to compromise the bullish phase that has been present for eight months.


