

What has taken place in the first 15 days of August 2019 confirms the statistics: together with July, August is the most difficult and bearish period of the year for the crypto sector. In the last 10 years, the average is always negative, as opposed to the remaining 10 months of the year.
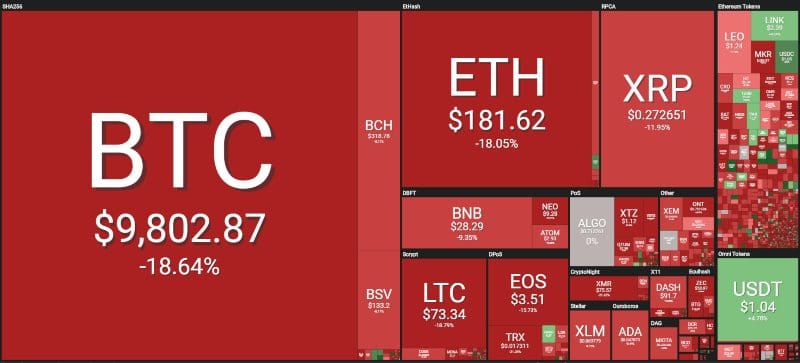
In the last few hours, the entire sector has decidedly moved downwards with double-digit losses. Of the top 100 capitalised, there are only two green signs: ICON (ICX) and Clipper Coin (CCCX), both up by more than 10%. All the others are in sharp contrast. Among the big names, the falls were particularly felt by TRON (TRX), Bitcoin Cash (BCH) and Ethereum (ETH), all three with losses of around 15%.
Summary
Bitcoin (BTC)
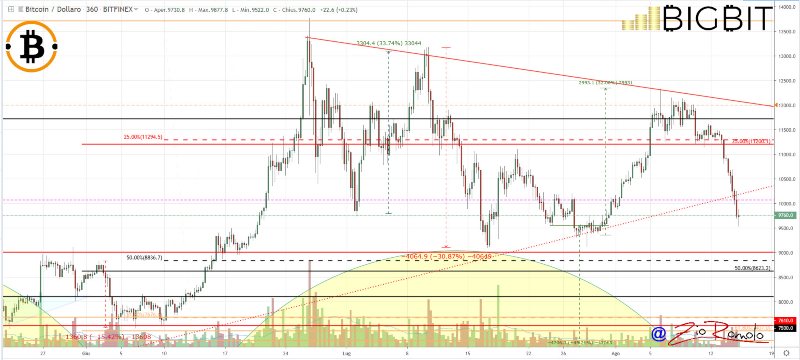
Until the first days of this week the queen of cryptocurrencies was surprising everybody with a behaviour that was clearly different from most of the sector. After trying to break, without success, the 12,000 dollar threshold, bitcoin has managed to hold on to the 11,000 dollar mark until the last 24 hours, before collapsing by over 1500 dollars in the last few hours, recording the third worst drop of the year (-8%).
A real disappointment after having recorded, with the closing on Sunday evening at 11500 dollars, the highest weekly peak since January 2018, but this has not triggered a further upward momentum, as many expected. With the rupture of the 9800 area during the European night, the trend of bitcoin in the medium term is downward.

Ethereum (ETH)
Ethereum has a different structure. On a monthly basis, taking as a reference the opening of August 2019 with prices close to 220 dollars, Ethereum has been below these levels since last weekend, showing a negative balance of over 15%. The bearish push of recent hours has caused prices to fall to $175, triggering the test of the upward trendline that has been supporting the bullish trend since last February.
In order for Ethereum to return to aspiring to new heights, recovering the levels abandoned in July, it is necessary to consolidate above 190-200 dollars.
Ripple (XRP)
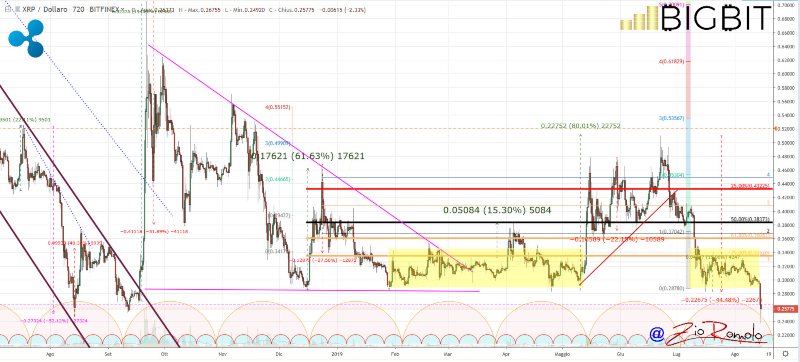
The technical structure of Ripple is quite different. For the past month, Ripple has been anchored to the $30 cents threshold.
Ripple needed a change of pace in order not to risk realising what is happening in the last few hours. The downturn of the last 24 hours caused Ripple prices to fall just below the threshold of 24 cents, the lowest level since December 2017.
Bitcoin Cash (BCH)
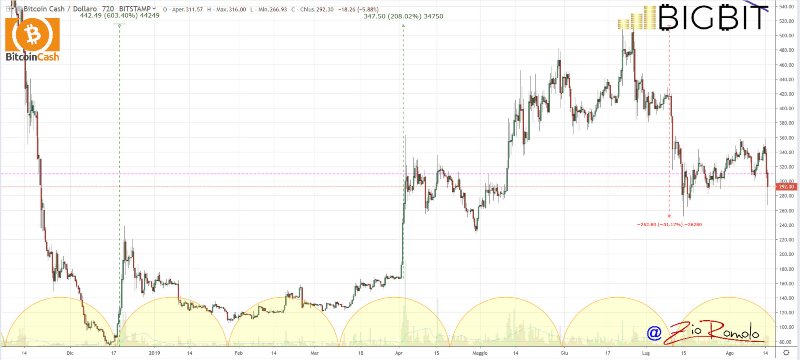
After attempting a clumsy recovery of 350 dollars, Bitcoin Cash in the last hours is recording one of the worst falls of mid-August with losses that are close to 20%.
For Bitcoin Cash it is necessary not to lose the support of the 275 dollars in order not to record dangerous sinkings under the 240 dollars, which is the next watershed level between Bears and Bulls in the long term.
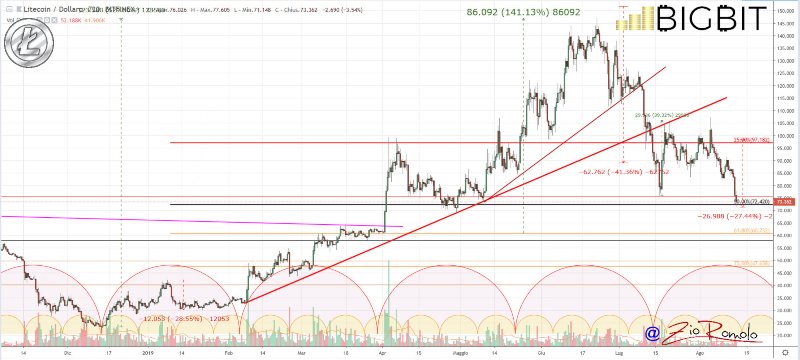
Litecoin (LTC)
With a -28%, Litecoin has also shown a negative balance since the beginning of August 2019. Instead of consolidating the pre-halving levels of 100 dollars, profit taking and a certain scepticism prevailed over Litecoin, which now sees prices testing the quarterly support of 70 dollars.
For Litecoin it is important not to abandon the threshold of 70-75 dollars otherwise it could create a significant downward trend and nothing prohibits the return to the $55 area in the coming weeks.
Crypto volumes and market cap
The volumes of the last week remain in the monthly average, despite the summer period seeing a decrease in trade. The declines that have accompanied the last 48 hours are recording a sharp increase in volumes, reaching the levels of mid-July.
August is a month that was characterised, for the first time after two and a half years, by bitcoin regaining 70% of dominance. The crypto market cap, after having exceeded 300 billion dollars, returns to mid-July levels. After the storm of mid-August that is affecting the market, there’s a need for a reversal and a recovery of the crucial levels as soon as possible in order to avoid the risk of losing all the momentum of the last three months.