The opening week of April is off to a strong start, with more than 85% of the most capitalized cryptocurrencies up and bitcoin’s dominance seemingly eroded.
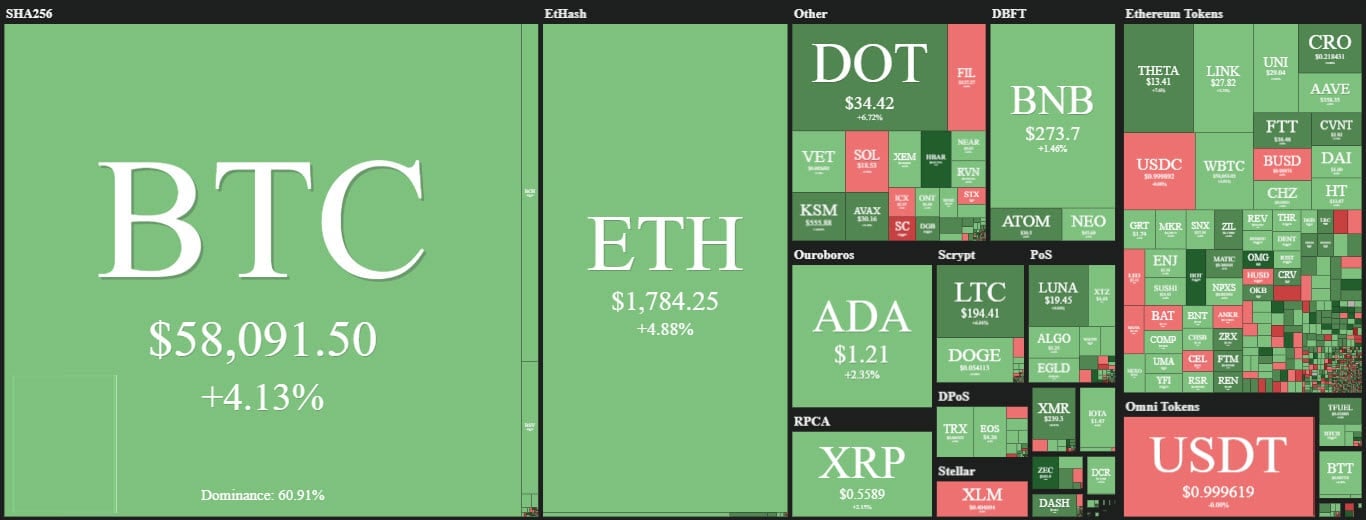
Over the weekend, there were already signs of a bullish reaction after a week of uncertain movements.
Among the most high-profile currencies, there were double-digit gains for the privacy coins, with Monero (XMR) rising more than 10% and ZCash gaining more than 25%. Both are now back to the relative highs of early March.
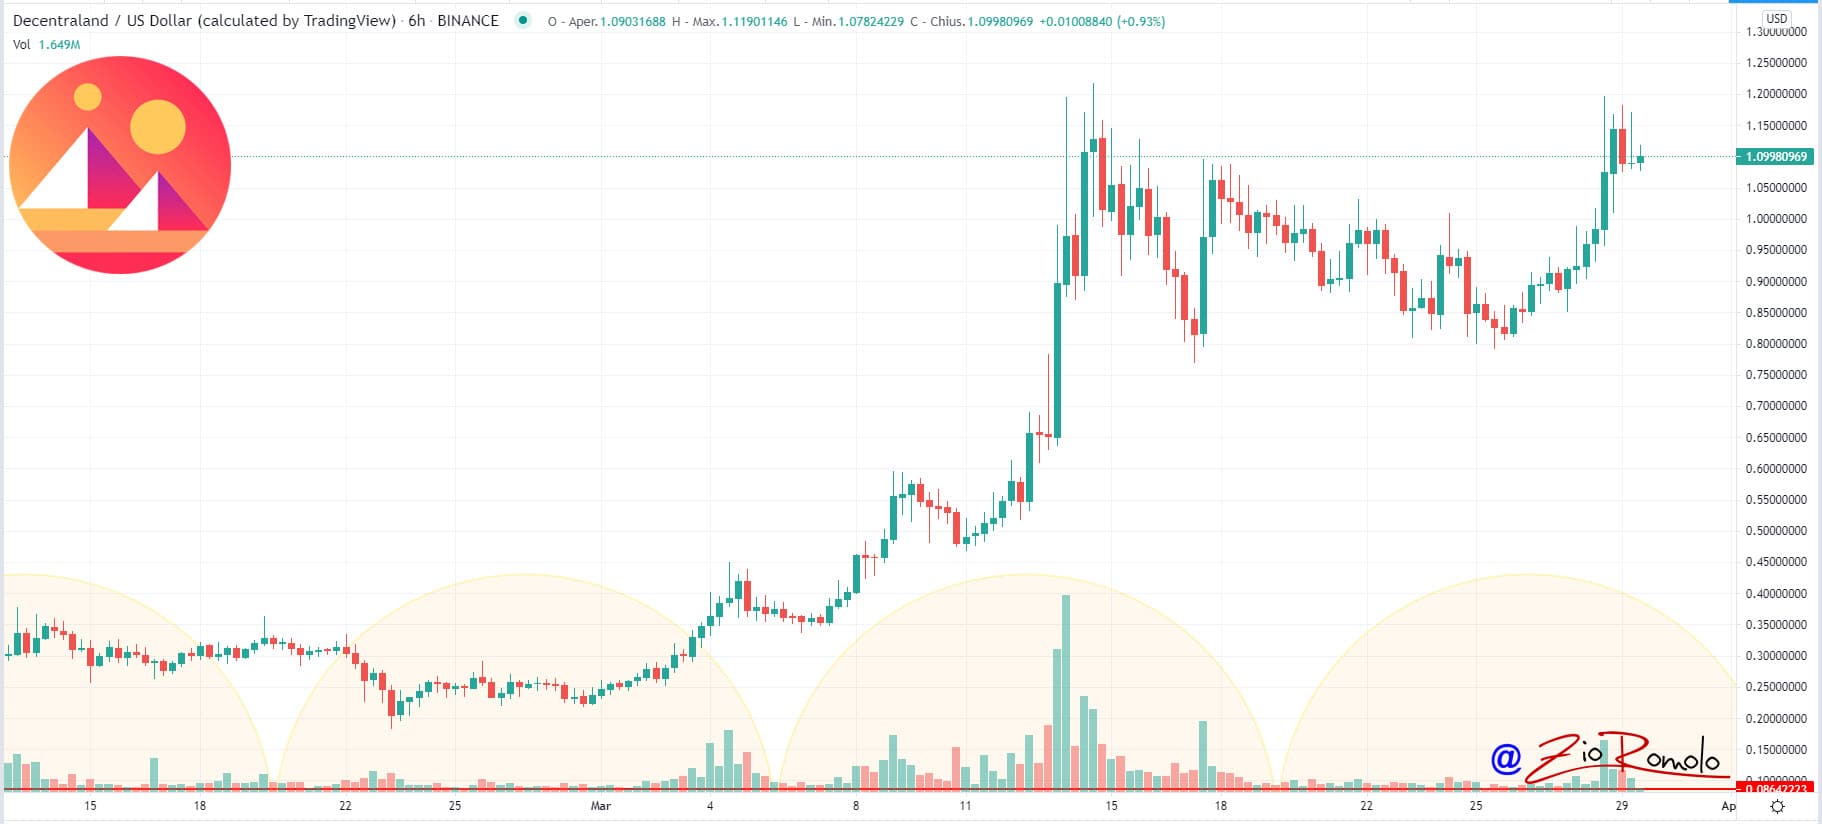
Among the coins attracting the most interest in recent periods in the NFT sector today are Decentraland (MANA) and Flow (FLOW) which are up 15%.
Bitcoin, record market cap but dominance declines
Bitcoin’s rise over the past few hours has put the market cap near all-time highs at $1.830 trillion. Bitcoin is within touching distance of $1.1 trillion in capitalization but is again losing the 60% market share threshold. This is a sign that although Bitcoin is leading the rise, it is the altcoins that are showing a more sustained climb.
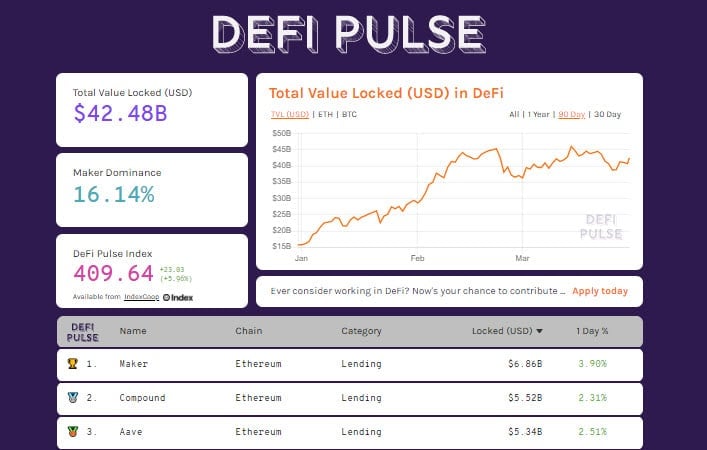
Decentralized finance is also back on the upswing and is back above $42.5 billion in turnover. The number of Ethereum locked in DeFi projects updates the record of the last 5 months, with 9.4 million ETH.
The largest options expiry on Friday has reduced the volume of open interest from over $14 billion to $10 billion. It will be interesting to see how traders reposition their new strategies in the coming days.
Bitcoin (BTC)
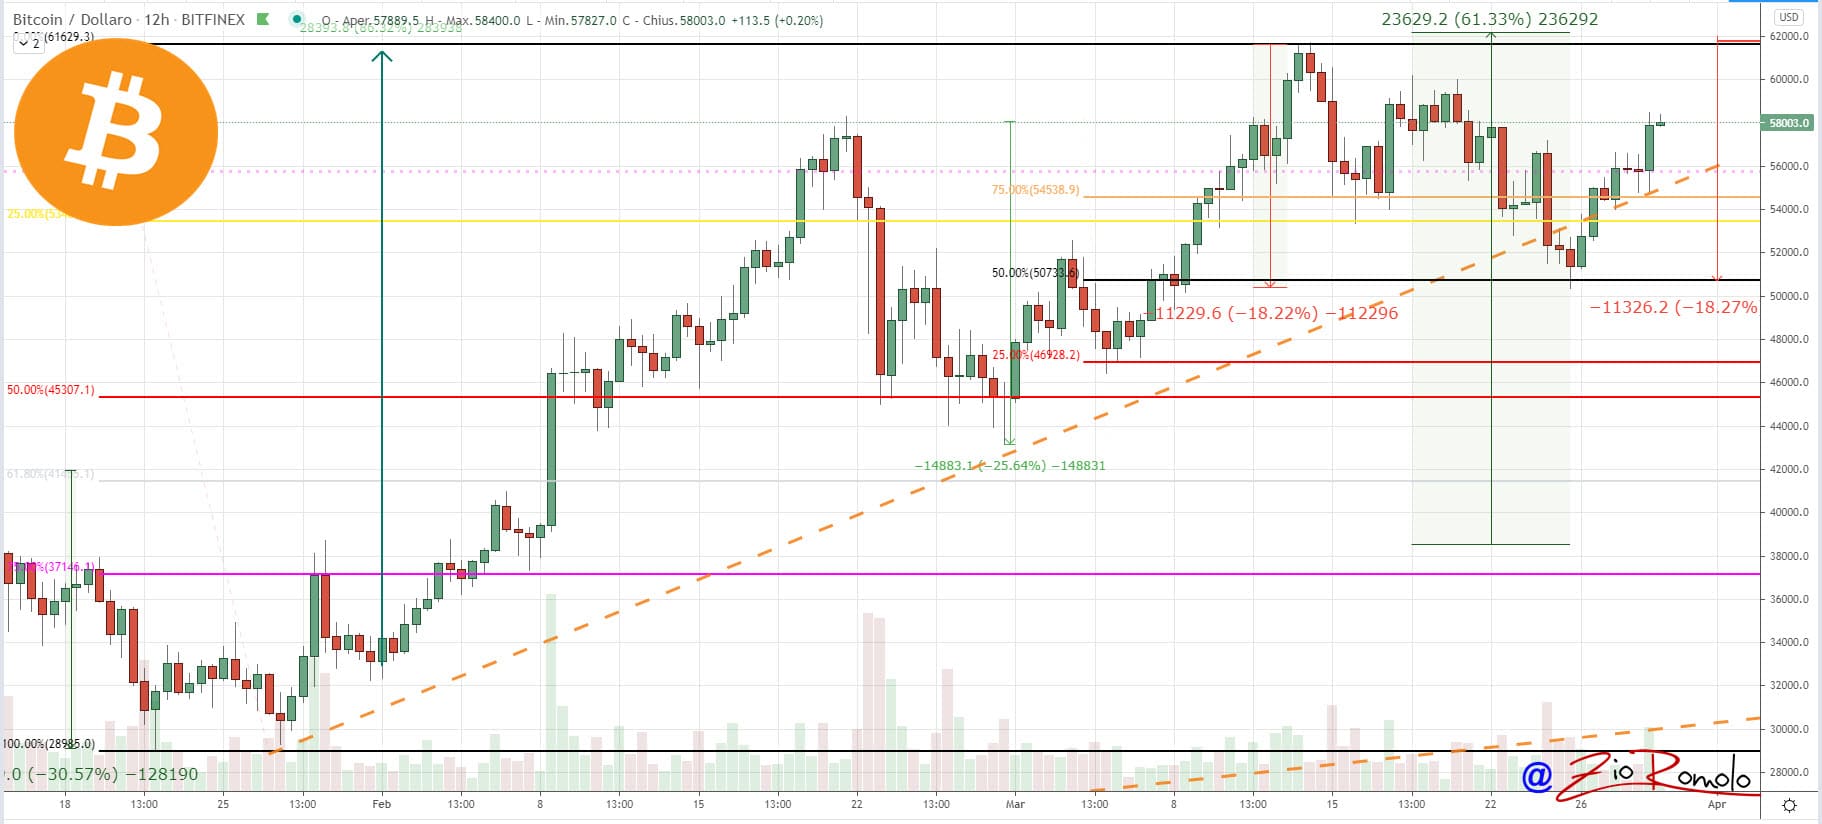
With the rise of the weekend reflected in the first part of today’s day, Bitcoin is back to within a step of $58,500, the highest level since March 21st, chasing away concerns of a plunge below $50,000, the lowest level recorded in the first week of March.
In the coming hours, it will be necessary to understand if the rise will be supported by volumes that in the last three days have remained above the monthly average.
Ethereum (ETH)
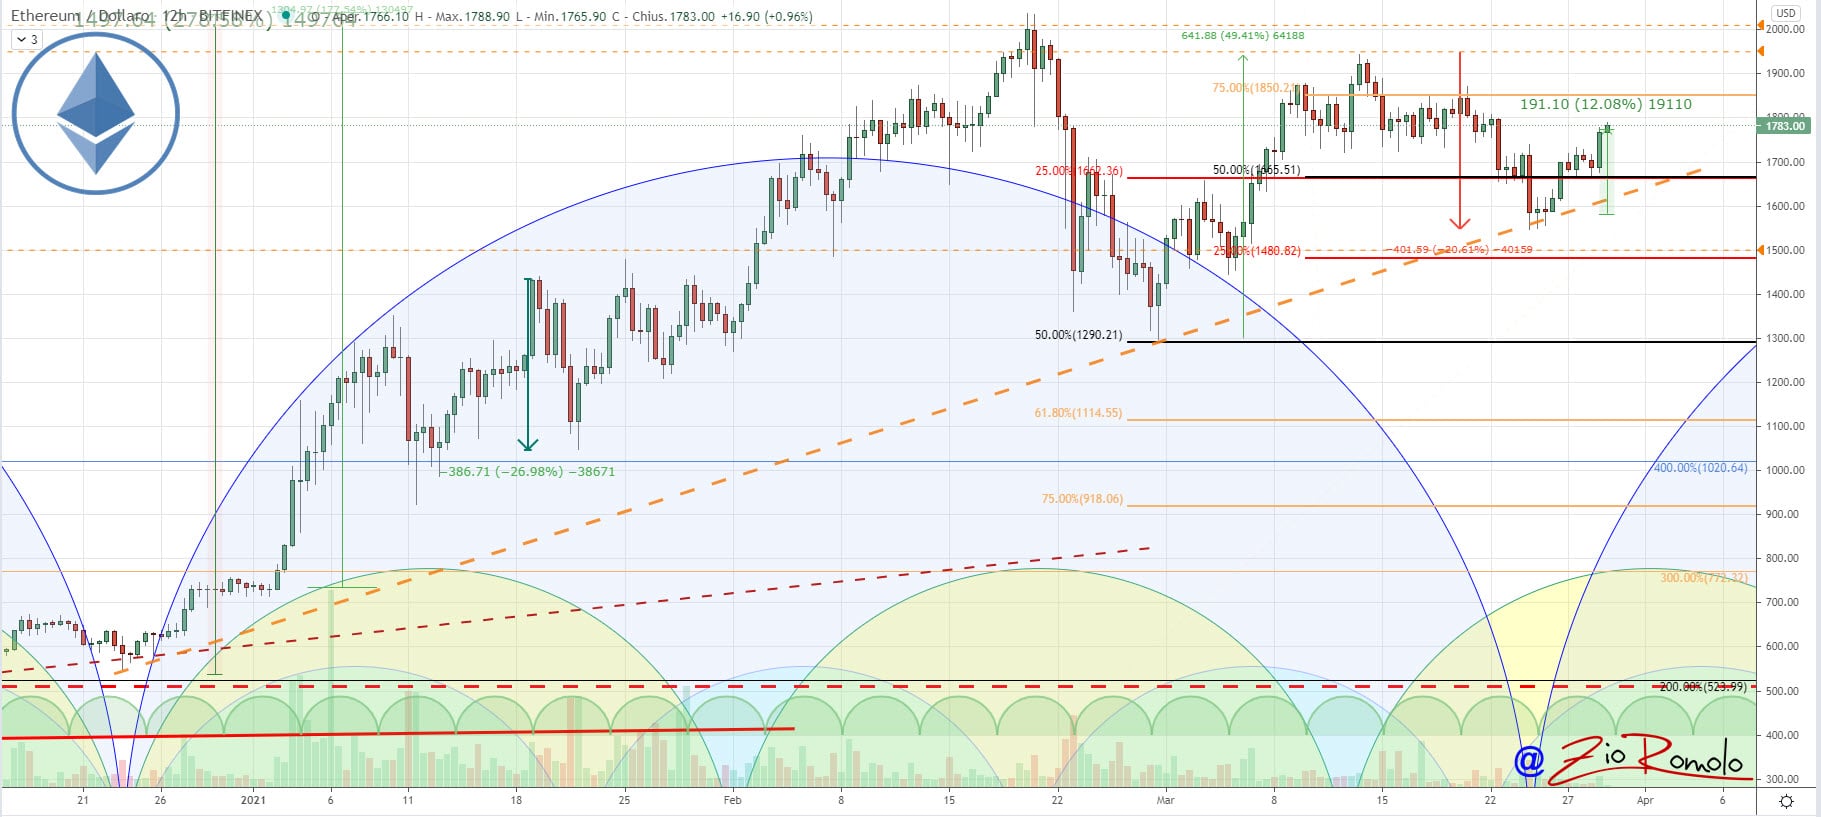
The price fluctuations that had characterized the movements of Ethereum from early March until the beginning of last week ended with the break-down of the $1,750 area which occurred exactly one week ago, Monday, March 22nd.
It was a movement that had caused concern for a closure of the quarterly cycle below $1,500, but in recent hours prices have returned above the support of $1,750, confirming the bullish structure that accompanies Ethereum since last December and that shows no sign of giving in.
This week it will be important to understand if the support of the purchases will continue with prices going back above $1,900, the highs recorded in mid-month.


