Ethereum price
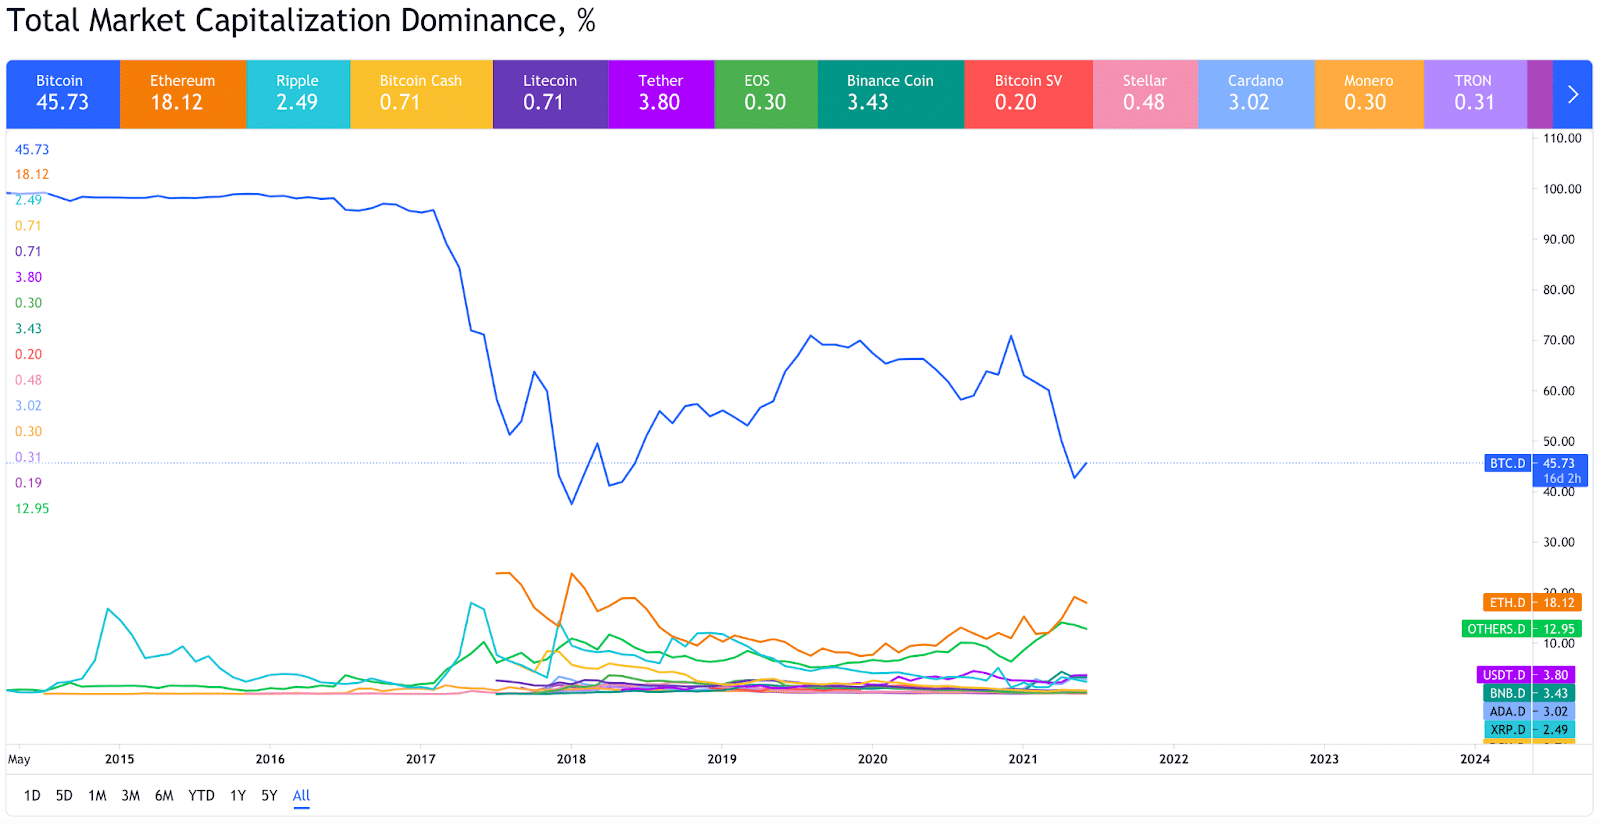
Ethereum’s [+1.32%] price strongly out performed Bitcoin (BTC) over the last 30 days and it is making a strong case that one day the flippening could occur.
The flippening is the name of the event that posits Ethereum will take over BTC’s grip on the number one market cap in all of the crypto space and ETH dominance will lead the way onward.
Many ETH enthusiasts believe the flippening is a certainty over time.
ETH/BTC over the past 90 days is +100% and for the last 12 months is 157%.

Ethereum managed to stay above $2k during the vast majority of the recent pullback. Ethereum’s price dipped briefly below $2k during the May and early June downtrend but bounced pretty quickly back above a critical support resistance and is holding strong.
The longer the price stays above $2,5k the more likely that $3k is challenged soon instead of revisiting the bottom of the structure again near $1,900.

The above chart from, kyer, of TradingView shows strong Ethereum accumulation around $2,500 with a very bullish snake being painted on the chart.
The local Ethereum top is $4,356 and was made just over a month ago on May 12th. It’s a long way back up to the local top and a new ETH all-time high but the crypto market moves swiftly.
Ether’s price has been a top performer over the last year and if the macro outlook stays bullish it could surprise people how fast it gets back to that peak.
On the contrary, if bearish sentiment takes over again and bears inflict a lot of pain on the market once more $2k ETH could be breached and the next major support zone would be around $1,400 and the former ATH set back in 2018.
Ethereum closed Monday’s daily candle at $2,581.
Aggregate Crypto Outlook
The aggregate outlook is the best it’s been across the market in over 30 days.
The total crypto market capitalization is $1.72 trillion at the time of writing and +2.4% for the last 24 hours.
It’s hard to believe but the aggregate crypto market capitalization on this date last year was $84.88 billion. That’s a 1,902% mark-up for the entire cryptocurrency market over the last 12 months.
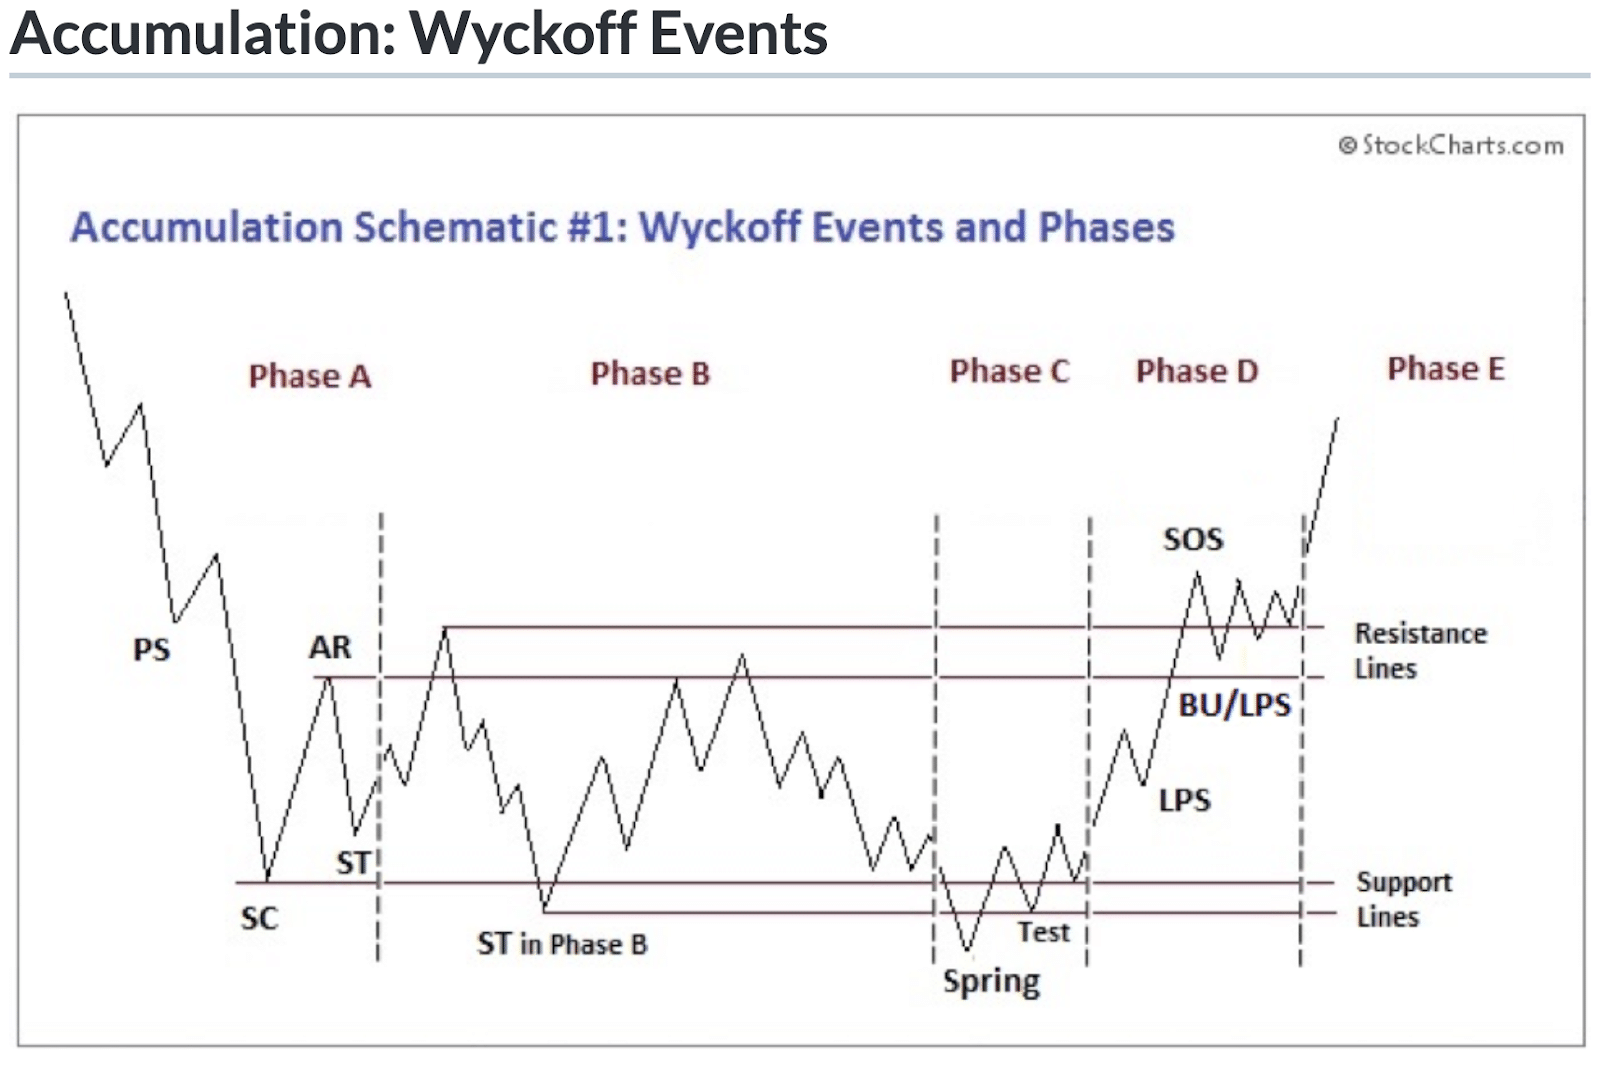
Traders and investors should be watching the Wyckoff Accumulation Schematic and BTC’s pattern closely over the next few months. From the relatively small amount of data that’s currently available to the market it appears BTC could be in Phase D of the event.

If Bitcoin is indeed in Phase D, the next 6 months could yield a lot of positive activity for market participants that are long in the crypto sector.


