Bitcoin Analysis
After failing again over the last week to break out of its structure with significant volume to the upside BTC found its way back below $35k on Sunday.
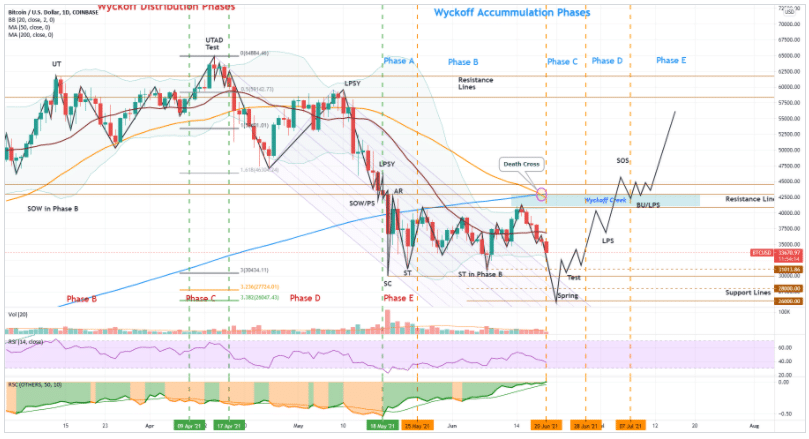
Bitcoin [-1.7%] is still in a Wyckoff Accumulation zone if you ask bulls. BTC bulls point to a number of variables that suggest the bull market is still very much ongoing.
BTC is still +276.6% for the last 12 months despite the pain over the last 40 days. The current price action reminds crypto OG’s a lot of this time last year when many were growing anxious. This was months after the legacy market and cryptocurrency market were affected by a black swan event and the BTC price had leveled around $9k after bouncing around $3,800.
The price of BTC 365 days ago was $9,678 and there was very little buzz at all about bitcoin or the cryptocurrency sector as a whole at this time last year.

The most overwhelming variable that supports the bulls case is timing. This would be the quickest close to a bull market in the history of the asset class. Over the previous cycles bitcoin drew down in price rather methodically and not 57.4% over 30 days like this recent capitulation event.
Bears however will likely tell you differently if you ask them if the bitcoin / crypto bull market has concluded.
The most obvious case the bear market has just begun would be the euphoria the market experienced in the beginning of May. There were projects like DOGE that went absolutely nuclear out of the blue.
Typically, that sort of euphoria is an indicator of a market top – whether that is the mid-top of the market or the full market cycle top is a developing story.
The below chart is from Crypto-Swing and shows his interpretation of Wyckoff Accumulation adjusted to the BTC 1D Chart.

BTC’s been hovering near the middle of its 52 week range of $8,857-$64,804 for over a month now.
Bitcoin had a daily / weekly candle close on Sunday of $35,432.
The Graph [GRT]
The Graph is in the midst of a post-Coinbase listing selloff that has trickled into a larger macro sell-off and more downside for The Graph’s token, GRT.
GRT is +1.6% for the last 24 hours but has lost more than 60% of its value over the past 3 months. GRT is -63.16% over the last 90 days at the time of writing.
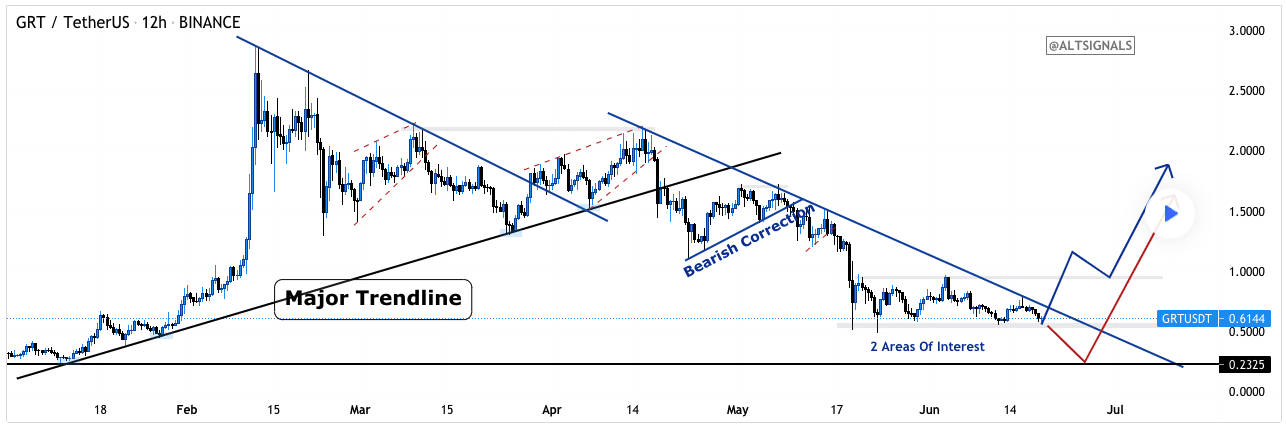
The Graph’s 12HR Chart finds the asset beneath a long term trendline that dates back to the middle of April.
There’s some hope for bulls if GRT can breach the overhead resistance around $.70 as charted by Altsignals of TradingView.

A contrary bearish outlook would look like a failure of GRT to break the overhead resistance and a prolonged accumulation phase on GRT below that trendline.
The Graph is the number #57 cryptocurrency project by market capitalization and made its all-time high on February 12th of $2.84.
GRT is -77.7% from its peak made in February of this year and that climax was reached 57 days after GRT’s Coinbase listing.
The Graph’s price after its Coinbase listing rose very high and rather quickly and GRT’s price has never been able to recover since that initial demand subsided from the listing bump.
GRT had a daily / weekly candle close of $.64 on Sunday.


