Bitcoin analysis
Bitcoin’s Monday price action had bulls and bears alike on edge as BTC’s $33k local bottom was nearly tested yet again. BTC’s price managed to battle back however from a sluggish morning and bulls defended $33,3k before pushing the price back above $34k heading into the day’s final 4hr candle.
Bitcoin’s had extremely low volatility for a number of consecutive days now and has remained stuck in a narrow price range of $33,329-$35,968 for the last 7 days.
Sentiment looks to be extremely split across crypto twitter about whether bitcoin and crypto as a whole are currently in a bull or bear market – the next few weeks could reveal the truth for certain.
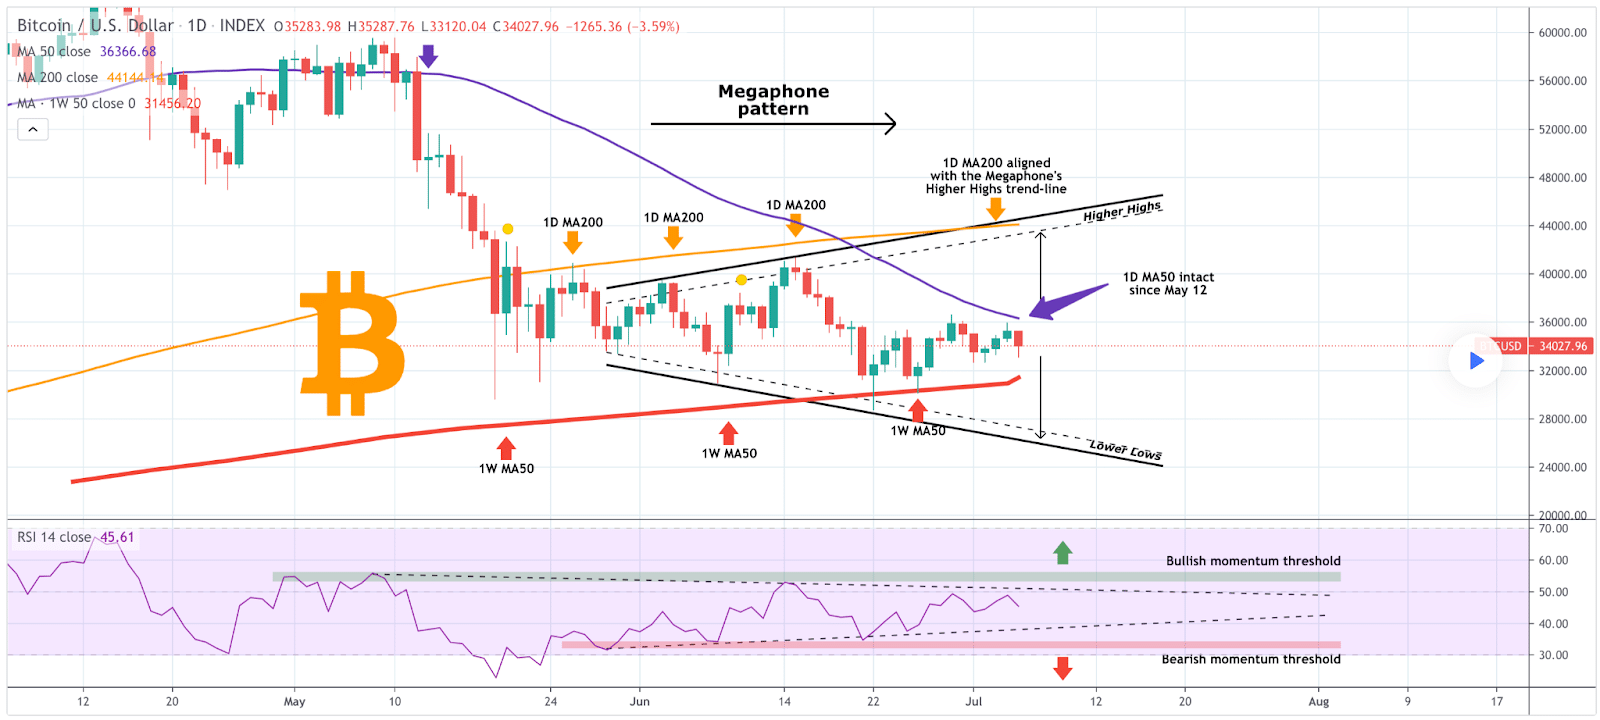
Below is TradingShot’s interpretation of the 1D chart and the denotation of the impending cross of multiple moving averages.

area of focus [for weeks] for traders between $41k-$44k.
Failure to get over the $41k BTC rubicon in time could cause support resistance at $33k eventually to fail and the bears could manage to continue to do damage to the downside of the chart.
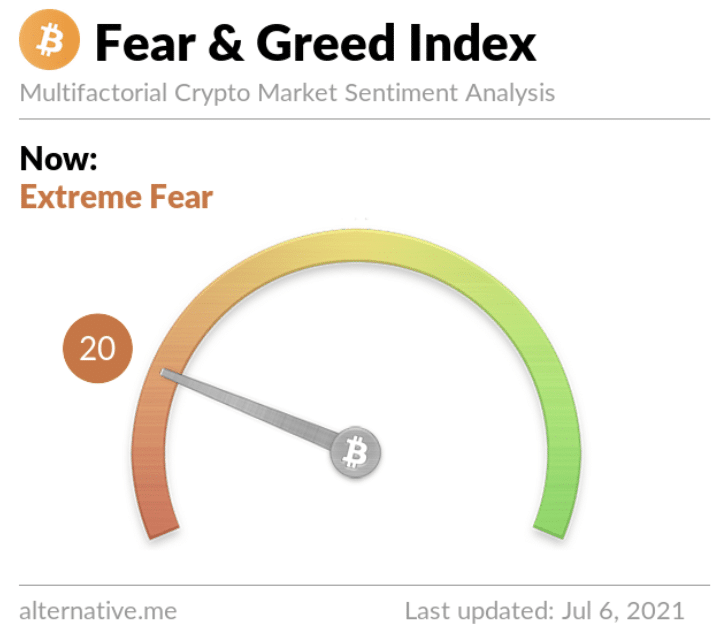
Bitcoin’s Fear and Greed Index is 20 and started Tuesday back in the Extreme Fear region of the index.

BTC had a daily candle close of $33,668 on Monday.
Chainlink analysis
Chainlink’s carved out serious support resistance at $18 over the past week and has spent much of the past 7 days bouncing around that price.
LINK’s weekly range is $18.33-$19.58 with extremely low volatility much like BTC on the week.
The Chainlink chart shows serious accumulation at this current price range is taking place which is normally met with a serious move to the upside or downside of the chart. With much anticipation of DeFi summer 2.0, LINK bulls are hoping this coiled snake is about to strike upward.
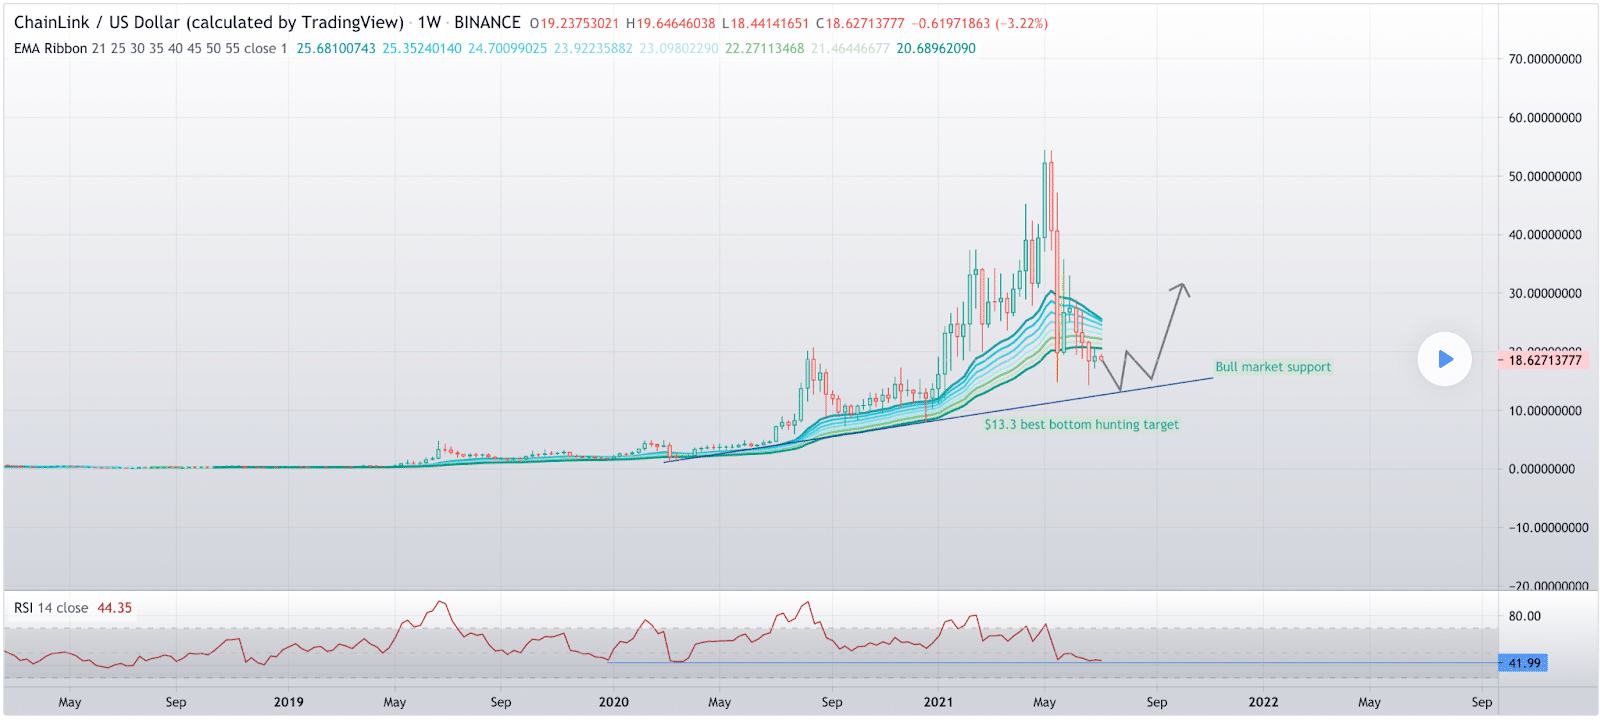
The below chart from Bulltoshi_NakaWOOto shows a long term trendline on the 1W chart dating back to March 2020 is acting as support for a LINK bull market. Support at that trendline takes the price all of the way down to $13.30 – that’s the lowest plausible entry for traders wanting to trade the bottom of this LINK bull market.

Bears are certainly aiming at pushing the price below $13.30 or are at least hoping to have that opportunity to wreck the bullish trendline LINK’s put in on this timescale for the last 491 days.
If bulls continue to contend at $18 and send the price back above the bands on the chart new all-time highs could be imminent.
On this date last year LINK’s price was $5.37. Since, LINK climbed all the way to a new all-time high of $52.70, added to their impressive list of more than 500 total integrations, released Chainlink white paper 2.0 and is being adopted by nearly every legitimate decentralized financial protocol in the sector to protect their users from data anomalies or bad actors.
Chainlink’s 7 day range is $17.94-$19.58. LINK’s 52 week price range is $4.75-$52.35.
Chainlink had a red daily candle close of $18.35 on Monday for its first red daily candle close in 4 days.


