After the aggregate cryptocurrency market cap decreased by $90 billion on Tuesday the market rallied to entirely erase those losses and closed the daily candle at $1.35 trillion.
Tuesday was the lowest close since February 7 for the aggregate market cap. Such a big rally following a crucial moment of the micro downtrend was monumental for bulls on Wednesday.
Bitcoin
Bitcoin bulls said ‘no mas’ and slaughtered many bears on Wednesday. BTC managed to stay above $29k and pushed the price back above $32k before the day’s final 4hr candle began.
So, what’s next for bitcoin now that bulls have won the most recent battle at $30k?

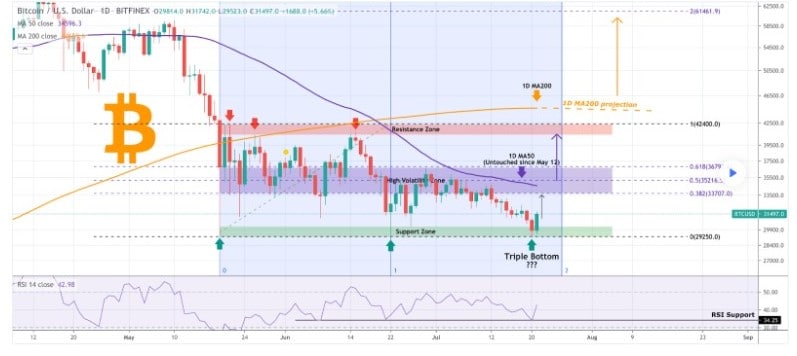
The above 1D chart from TradingShot shows a triple bottom on bitcoin which is historically a key indicator that a trend is about to reverse its course.
Also, Bitcoin is above the inflection point on the 4hr chart and has rallied after the completion zone of a bullish bat reversal at the time of writing. A higher low at the top of the bullish bat at $35,8k could be the confirmation needed for market participants with money sitting in stable coins on the sidelines to re-enter the market.
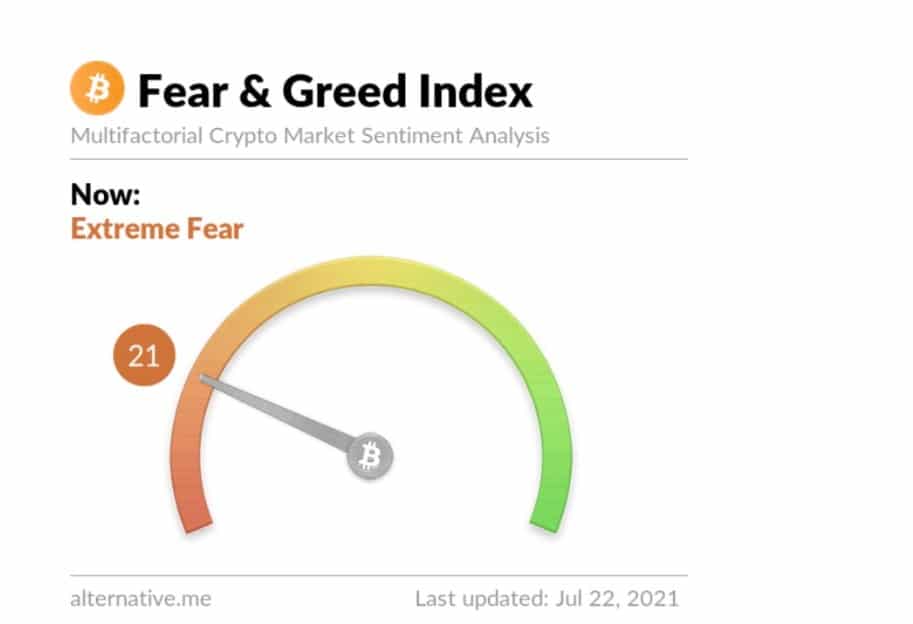
BTC’s Fear and Greed Index reading is 21 and +11 points from the day before.

Bitcoin’s 24 hour range is $29,641-$32,502 and the 7 day range is $29,599-$33,098. Bitcoin’s 30 day average price is $33,184.
BTC closed Wednesday’s daily candle worth $32,141 breaking up a streak of 2 straight daily closes in red figures.
Polygon [MATIC]
After weeks of the MATIC price being pushed lower Ethereum’s most popular side-chain rallied as much as 35% on Wednesday. Polygon’s price is back above $.9 after falling below $.7 on Tuesday for lows not seen since earlier this year.

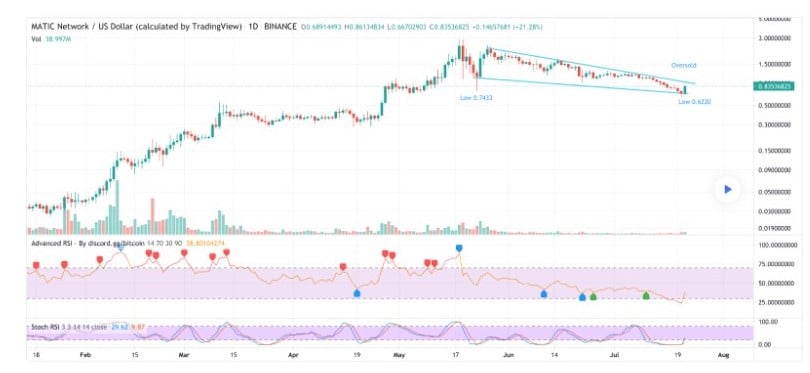
The above chart shows how extremely oversold MATIC was on the daily chart.
Further upside can be expected above $.83 if MATIC’s price stays above the structure it broke out of to the upside on Wednesday.
Bears will hope they can push the price back inside the structure and back to the bottom of the range at $.622 to ruin much of the hope around a quick recovery.
MATIC’s 24 hour range is $.673-$.935 and the 7 day range is $.635-$.935. Polygon’s average price for the last 30 days is $1.01.
MATIC closed Wednesday’s daily candle worth $.887. Polygon is the #17 ranked digital asset by market capitalization and avoided a tenth consecutive close in red figures with a green daily close on Wednesday.


