Summary
Bitcoin Analysis
Bitcoin dominance is under 40% at the time of writing and could be heading back to test the 37% level that it reversed at months ago before retaking 45% market capitalization dominance.
What should traders expect from bitcoin this week?
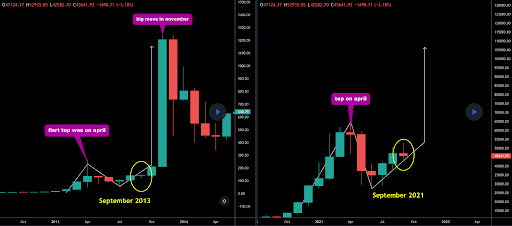
The chart beneath is an interesting piece of data to observe regardless of whether traders are bullish or bearish. The case could be made that up until recently bitcoin was following 2013’s bull market cycle.
While this doesn’t mean the bull market is over it is interesting to take into account that there are bullish and bearish cases that can be made and it’s not obvious what’s coming next.

The top of bitcoin’s price action was also in April of 2013 and the market experienced a major correction in May and June before recovering in August of that year.
It’s also interesting that in September of that year there was a slight correction and sideways price action that preceded bitcoin’s first major bull run and blow-off top.
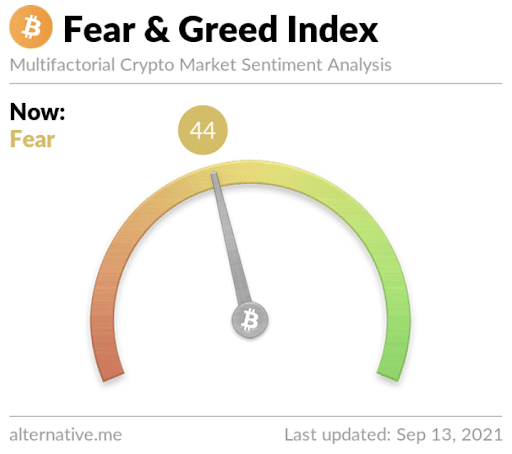
The Fear and Greed Index is at 44 and +12 from yesterday’s reading of 32 that is also in the ‘Fear’ zone.

Bitcoin’s 24 hour price range is $44,814-$46,494 and the 7 day price range is $44,814-$52,744. BTC’s 52 week price range is $10,255-$64,374
Sunday’s daily / weekly candle closed for bitcoin worth $46,069 and in green figures for the day. The weekly candle closed in green figures as well after closing in red figures last week and breaking a streak of 9 straight weekly closes in green digits prior.
Ethereum Analysis
Ether’s price action is again in sync with bitcoin’s price action and is also trading in a multi-week range.
So, what should traders expect from ETH in this new week?
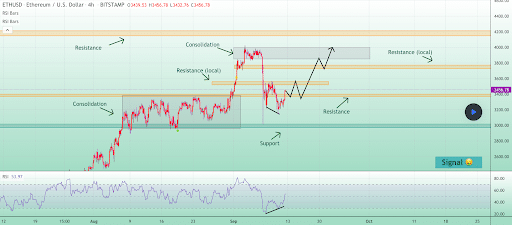
The below 4hr chart from Solldy shows bullish divergence manifesting that could give bullish traders some hope for a week to the upside after a rough couple of weeks for ETH bulls.
Traders will notice that there’s strong support at the $3k level and that ETH’s currently trading in a $400 range at the time of writing between $3k-$3,400. If Ether bulls can send the price back above $3,4k then they may be able to head back up and test its recent local top just under $4k.

Ether dominance is 18.1% and it’ll be interesting to track where it goes over the next 6 months as this market cycle could wind to a close if history repeats this winter.
Ethereum’s 24 hour price range is $3,249-$3,460 and the 7 day price range is $3,173-$3,960. ETH’s 52 week price range is $320-$4,352.
Ether closed the week’s daily candle in green figures and valued at $3,407. ETH closed the weekly candle in green digits and has closed 3 out of the last 4 weeks with positive price action.


