Summary
Bitcoin Drop
Bitcoin’s price dropped early in Monday’s daily candle and re-tested prices near the bottom of a large range it’s been trading in since the end of July.
After getting rejected at the top of its current channel during the first week of September, bitcoin’s price dipped back to the bottom of its range at the $43k level and even wicked lower briefly during Monday’s daily candle.
So, what can BTC’s 1D timescale tell traders as they eye the close of 2022?

The chart above from EXCAVO shows the potential for BTC to trade in its current descending channel until $39k-$40k and then test market sentiment at that level.
If bulls want to again take control of the ball they need to send the price back to the top of its current range and break $50k. If bulls can take that level and then break $53k to the upside with heavy volume, BTC could again prove to market participants that a bull cycle is ongoing.
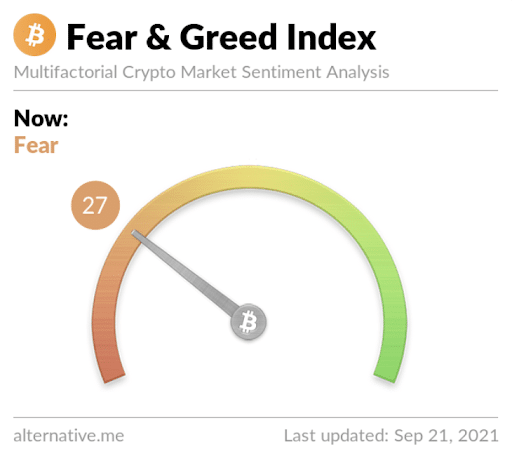
The Fear and Greed Index is reading 27 for Tuesday and in the Fear zone – yesterday’s reading was 50 and Neutral.

BTC’s 24 hour price range is $40,768-$47,404 and the 7 day price range is $40,768-$48,852. Bitcoin’s 52 week price range is $10,255-$64,374.
Bitcoin’s average price for the last 30 days is $47,670.
BTC [-8.97%] closed Monday with a bearish engulfing candle and in red figures for a second straight day.
Ethereum Analysis
ETH dipped double digits by percentage on Monday and followed the macro down on the day.
I wrote in yesterday’s column about the importance of bulls reclaiming the $3,5k level soon and they failed as bearish traders sent the price lower before that could happen.
Q4 is only 10 days away, where will Ether market participants send ETH next, is there further downside yet to come?
The below chart from fxswint implies there could be further downside before the bearish momentum wains.
There’s support resistance for Ether at $2,955 on the 4hr timescale and $2,620 has proven extremely strong support resistance in the past on the daily chart.

Ether bulls risk a trip to visit the $2,620 level if they lose the current battle at $3k. If bears can push the price below the $2,620 level a longer bear market could potentially be looming.
Ether’s 24 hour price range is $2,837-$3,324 and the 7 day price range is $2,837-$3,665. ETH’s 52 week price range is $320-$4,352.
Ether’s 30 day average price is $3,411.
ETH [-10.59%] closed Monday’s daily candle worth $2,975 and in red figures for the second consecutive day.
ADA Analysis
Cardano’s fortune has shifted for now after climbing much of 2021. Since making its all-time high of $3.09 on September 19th ADA’s price has decreased by 31.5%, at the time of writing.
ADA broke the $1 threshold on February 20th of this year and its price has respected that level as strong resistance on multiple occasions. A drawback of that nature would first have to break down at two other levels.

The chart above from FieryTrading shows that bulls should have support resistance at two levels below the current price. Firstly, there should be support at $1.8, then $1.6 and potentially at $1.2 before testing the strong historical resistance level of $1.
Bearish ADA traders first need to crack $2 again and close below that price on a significant timescale if they want to test the $1.8 level and lower.
If ADA can chop sideways between $2-$2.20 for a sustained amount of time the likelihood of bullish divergence increases and maybe ADA can get back on the bullish track.
ADA’s 24 hour price range is $1.98-$2.26 and the 7 day price range is $1.98-$2.57. Cardano’s 52 week price range is $.075-$3.09.
Cardano’s 30 day average price is $2.60.
ADA [-9.31%] closed Monday’s daily candle worth $2.06 and in red digits.
Cardano [-13.98%] also closed the weekly timescale in red digits on Sunday for a fourth consecutive week.


