Bitcoin Analysis
Bitcoin’s price wicked down to touch the bottom of the trendline pictured below on the 1D chart by TradingShot on Tuesday.
BTC eventually broke then closed below the point of emphasis on the chart at $41,195.
Now, traders wait to see if BTC can hold possibly the most important level of inflection between a bull and bear market left at the $40k level.
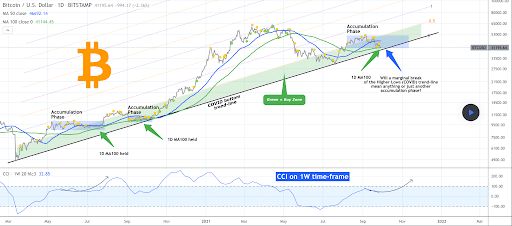
BTC also broke its demand line on its 4hr chart just before Tuesday’s daily candle closed.
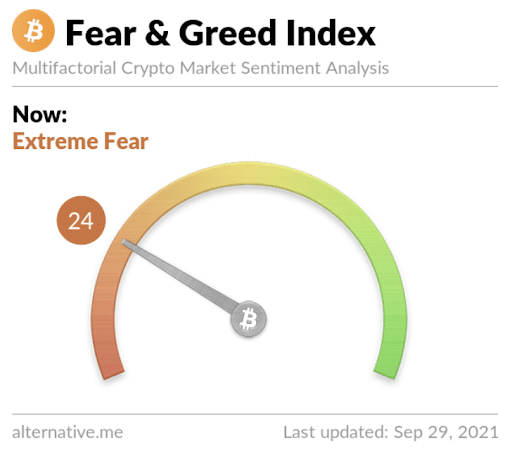
The Fear and Greed Index is 24 and in the Extreme Fear Zone. Today’s measurement is -1 from yesterday’s measurement of 25 that’s also in the Extreme Fear Zone.
BTC’s 24 hour price range is $40,988-$42,837 and its 7 day price range is $40,930-$45,168. Bitcoin’s 52 week range is $10,476-$64,804.
Bitcoin was $10,672 on this date last year.
BTC’s 30 day average price is $46,145.
Bitcoin [-2.67%] closed Tuesday’s daily candle worth $41,064 for a second consecutive daily close in red digits.
Summary
Ethereum Analysis
Ether’s price action continues to revolve around the $3k level and an ongoing battle between bullish and bearish traders continues with bears currently in control.
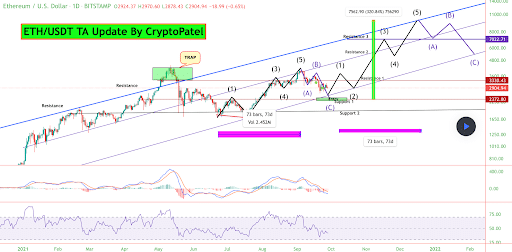
The 1D ETH chart above from CryptoPatel posits a bearish outlook in the interim for ETH’s price. Bears are currently controlling the price below $3k, at the time of writing.
If bulls want to send the price higher and make new highs in 2021 they’ll need to reclaim $3k ETH as a primary target. Following that level bulls will need to send the price above $3k and then $3,3k to reestablish control of Ether’s price.
Conversely, bears need to send ETH’s price down to test $2,6k. If they can test that level and break it to the downside, bears may be settling in for an extended bear market and it may be the onset of a crypto winter.
Ether’s 24 hour price range is $2,798-$2,973 and its 7 day price range is $2,750-$3,178. ETH’s 52 week price range is $337.42-$4,352.11.
ETH was worth $354.43 on this date last year.
Ether’s 30 day average price is $3,341.
ETH[-4.04%] closed Tuesday’s daily candle worth $2,807 and in red digits for a second straight day.
Avalanche Analysis
The AVAX 1D chart below from Guapeva shows AVAX currently back beneath the middle of its current ascending channel.
Bullish AVAX traders will want to again re-test the top of its ascending channel soon which would eventually take the price to three figures or a trip back to the support level of $50 could be forthcoming.
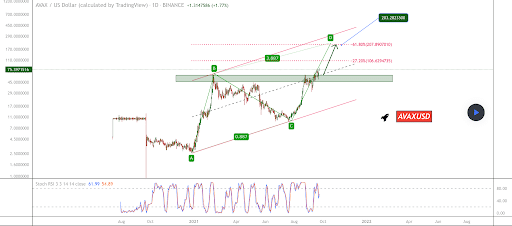
The volatility of AVAX over the last few months has been strong so if the macro [bitcoin] manages to again trend to the upside traders could see AVAX pivot to the upside and continue its larger bullish trend quickly.
Despite decreasing in price 22.7% since its ATH of $79.31, AVAX is +425% against The U.S. Dollar, +346% against BTC, and +321.5% against ETH over the last 90 days.
Avalanche’s 24 hour price range is $61.44-$69.27 and its 7 day price range is $58.72-$79.25. AVAX’s 52 week price range is $2.82-$79.31.
AVAX was worth $4.21 on this date last year.
Avalanche’s is still above its 30 day average price of $55.97, at the time of writing.
AVAX [-7.16%] closed Tuesday’s daily candle valued at $61.55 and in red figures for the fifth day in a row.


