Summary
A rally for Bitcoin
After last week’s late weekday bitcoin rally from a low of $41,064 to $49,167, BTC managed to hold on to those gains over the weekend. Bitcoin also bullishly engulfed to close its weekly candle.
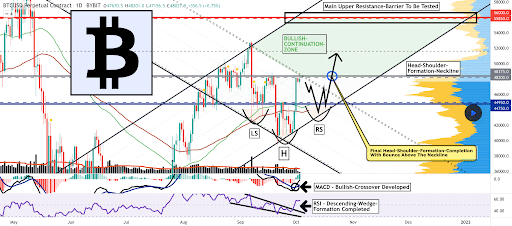
The 1D BTC chart below from VincePrince shows multiple backtests of the $40k level that bitcoin put in before bulls absorbed the remaining supply at that level and the demand evaporated before heading back up to test the the top of its range again.

The chartist above posits that BTC could be in the midst of completing an inverse head and shoulders pattern which could see the price dip back to form the right shoulder just above $44k.
It’s important for bulls to hold that level in the interim while bears will be trying to send the price below that level to retest $40k again.
The main upper resistance barrier to be tested for bullish traders if the price does indeed continue higher is $55,220-$56,630 on the daily timescale.
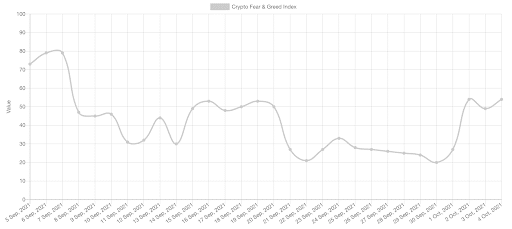
The Fear and Greed Index is 54 and +5 from Sunday’s reading of 49. The index displays just how much the crypto market’s sentiment has shifted over the last week after putting in a monthly low of 20 on September 30th.

BTC’s 24 hour price range is $47,260-$49,403 and the 7 day price range is $41,064-$49,167. Bitcoin’s 52 week price range is $10,577-$64,804.
Bitcoin’s price was $10,784 on this date last year.
BTC’s 30 day average price is $45,878.
There’s also confluence on the aggregate crypto market cap chart showing the fact that if the agg market cap closes in 27 days where it is today it will be the highest monthly candle close in bitcoin’s history – there’s a long way to go but this would be a feather in the cap of bullish traders across the cryptocurrency market.
Bitcoin closed its daily / weekly candle worth $47,675. BTC closed its daily candle +1.19% and has finished in green figures for 4 of the last 5 days. On the weekly timescale BTC closed +11.62%.
Ethereum Analysis
Ether’s price stalled out when bullish Ether traders again tested the $3,5k level over the weekend. Bears may have won that battle but will they win the Q4 war which is now underway?
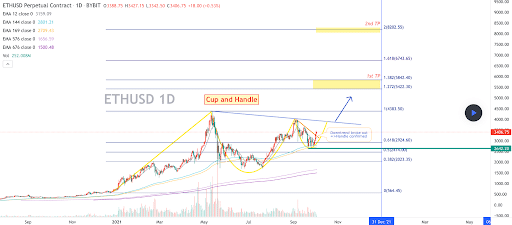
Ether bulls may be a little more confident with the recent development of what looks to be a cup and handle on ETH’s daily timescale breaking out and with ETH already back-testing this level, at the time of writing.
The 1D ETH chart from EthanTW illustrates just how bullish ETH’s price action could be if the macro allows it to reach its pattern completion zone over the coming months.

This may be the last stand for bears below $3,5k. If bears lose this level it could be a quick trip to the $4k Ether level for bulls.
Bears have been unable to send the price below the $2,6k level and for that to happen they must again reclaim the price below $3k firstly.
ETH bulls however will be looking to hit these overhead targets that correspond with fibonacci levels above:
- a) 5,422.30-5,842.40 – Fib(1.272-1.382)
- b) 8,202.55 – Fib(2)
ETH’s 24 hour price range is $3,379-$3,498 and its 7 day price range is $2,801-$3,498. Ether’s 52 week price range is $337.42-$4,352.11.
Ether’s price on this date last year was $353.60.
ETH’s 30 day average price is $3,289.
Ether closed its daily / weekly candle worth $3,416. ETH’s daily candle closed +.82% and its weekly candle closed +15.96%.
Polkadot Analysis
DOT’s price reversed course last week and Polkadot bulls negated a head and shoulders pattern that was setting up for much lower prices before the rally.
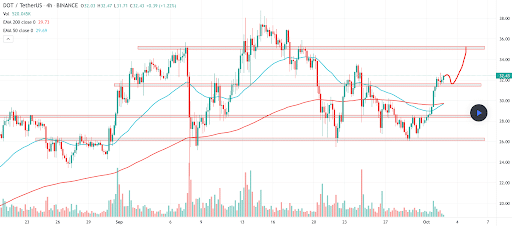
The 4hr DOT chart below from riazhussain shows DOTs price currently holding above the 50 EMA and 200 EMA and setting up for higher prices potentially if the macro landscape coopererates.

Bullish DOT traders will first have their eyes set on the $35 level as a primary target and they’ll want to flip that level to support soon.
Bearish Polkadot traders will again want to push the price below the 50 EMA at $29.69 and the 200 EMA at $29.73. If they can push the price below $30 which is proving to be a major level of inflection bears still have hope.
DOT’s 24 hour price range is $30.86-$32.93 and the 7 day price range is $26.23-$33.27. Polkadot’s 52 week price range is $3.68-$49.74.
Polkadot’s price on this date last year was $4.32.
DOT’s 30 day average price is $31.44.
Polkadot closed its daily / weekly candle valued at $32.10 and in green figures. DOT’s daily candle closed on Sunday +0.15% and its weekly candle closed +7.44%.


