Summary
Bitcoin price
Bitcoin’s price traded in red figures on Tuesday and finished -$1,501.
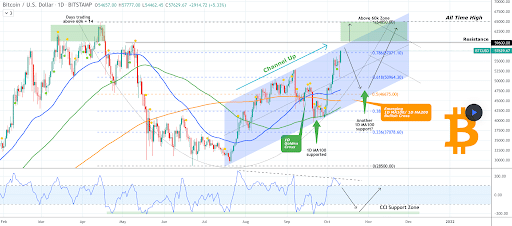
The 1D BTC chart below from TradingShot shows bitcoin potentially painting a giant cup and handle pattern. If this pattern plays out, it could be the size and type of momentum built structure that takes BTC’s price to $100k and potentially beyond.
It will be integral for bulls to hold the 0.786 fib level to paint this pattern to completion. If this is indeed what’s forthcoming for bitcoin market participants it could be a brilliant close to 2021 for bulls.
If bearish traders want to wreck bullish dreams they’ll want to send the price below the .618 fib level [$50,964.30] and eventually below $50k.

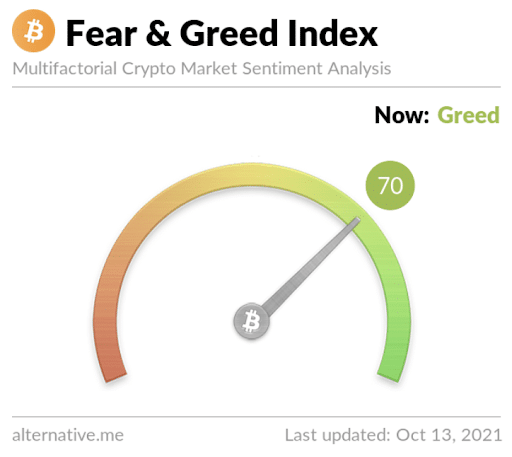
The Fear and Greed Index is 70 Greed and -8 from Tuesday’s reading of 78.

BTC’s 24 hour price range is $54,704-$58,065 and the 7 day price range is $50,715-$58-065.. Bitcoin’s 52 week price range is $11,426-$64,804.
BTC’s price on this date in 2020 was $11,426.
The average bitcoin price for the last 30 days is $47,985.
Bitcoin [-2.61%] closed Tuesday’s daily candle worth $55,967 and in red digits.
Ethereum Analysis
Ether’s battle at the $3,5k level is beyond legendary at this point.
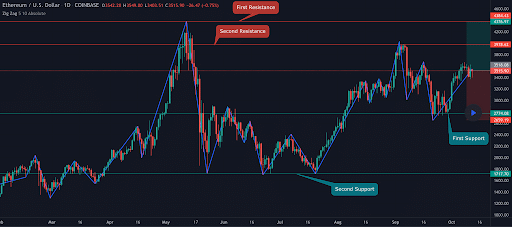
The 1D ETH chart below from Evelynn56454 shows Ether right in between support resistance [$2,772] and overhead resistance $3,978.
If bulls can push ETH’s price to the second resistance on the chart [$4,384] bulls will be in charge of the price action with a blue sky breakout coinciding with a new Ether all-time high.
Conversely, if Ether bears can send the price down to the second support resistance [$1,717] they’ll be in control of the momentum.

ETH’s 24 hour price range is $3,426-$3,546 and its 7 day price range is $3,375-$3,668. Ether’s 52 week price range is $365.41-$4,352.11.
Ether’s price on this date last year was $381.17.
ETH’s 30 day average price is $3,283.
On Tuesday, Ether [-1.58%] closed its daily candle at $3,489 and in red figures.
Binance Coin Analysis
Binance Coin’s price dropped with the majority of the market early on in Tuesday’s daily session but rebounded during the day’s second 12 hour candle.
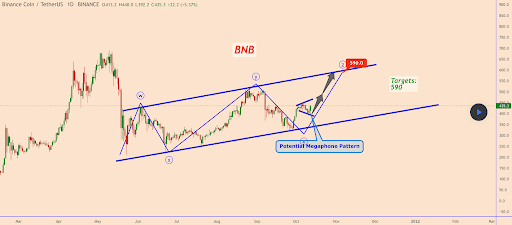
The BNB / USDT 1D Chart below from KlejdiCuni shows that BNB could be heading for a potential breakout to the upside with an overhead target for bulls at the top of the range at $590.
After holding support at the $290 level in September and maintaining a long term trend back to May, bears will need to break that level or they risk giving up more upside to BNB bulls.

BNB’s 24 hour price range is $394.91-$446.35 and its 7 day price range is $394.91-$449.81. Binance Coin’s 52 week price range is $26.27-$684.83.
BNB’s price on this date last year was $30.69.
The average BNB price for the last 30 days is $400.27.
Binance Coin [+7.5%] closed Tuesday’s daily candle worth $444.4 and in green digits for the second straight day.


