


This article explores the nature of cryptocurrencies, specifically altcoins. In a previous article we saw that by setting up a simple “trend following” strategy on Bitcoin which buys and sells at the high and low of the previous day respectively, the results were very encouraging.
The systematic operativity would have guaranteed good profits, against more contained drawdowns, when compared to the simple buy&hold. This is primarily due to the fact that a long/short trading regime is certainly more conservative in some respects than a “drawdown” trading regime.
Altcoins in the crypto market
As is well known, the landscape of tokens and cryptocurrencies is growing considerably. Over the past few years, the so-called altcoins have made a strong entry into the global crypto scene and have gradually taken over an increasing share of the total market. The question then arises:
- Is it possible to use them in a systematic way as is the case with Bitcoin?
- What would be the advantages?
To answer these questions we base ourselves on simple rules, applicable to any type of market. For example, how would the same trend following strategy work in the altcoin market?
How does the trend following strategy work on altcoins
The idea is to check if switching from Bitcoin to other crypto assets continues to show encouraging results. This would also confirm the soundness of the Bitcoin strategy, because if a trading idea works well in different markets then there is reasonable certainty that it is a sound strategy. Furthermore, from a diversification perspective, it is well known that two strategies are better than one. That three strategies are better than two. And if they are on different markets, even better.
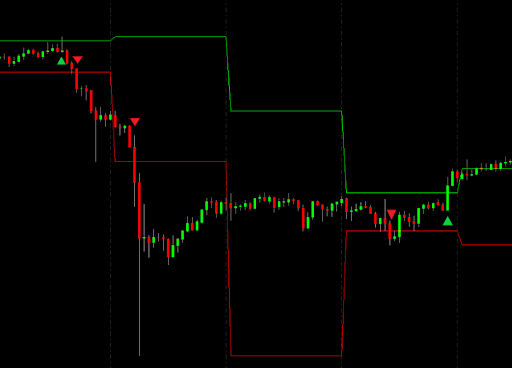
We proceed therefore with a test portfolio, calculated on a basket of instruments, on which we will go to apply a trend following strategy with really simple rules. We buy when the market breaks the high of the previous session, and short when the market breaks the low of the previous session. In terms of rules, this strategy is the same as shown in the Bitcoin trends article.
Figure 1 shows an example of the considered pattern.
The basket of altcoins taken in consideration has been selected according to two criteria:
- liquidity, as we want to operate only on liquid markets, which do not expose to slippage risk (operational cost resulting from the difference between theoretical entry price and price actually executed);
- depth of the historical data, at least 6 months of data on which to be able to go to execute the strategy.
Inside there are::
- AAVE (Aave Protocol)
- ADA (Cardano)
- ATOM (Cosmos)
- AXS (Axie Infinity)
- BNB (Binance)
- CRV (Curve)
- DOGE (Dogecoin)
- DOT (Polkadot)
- ETH (Ethereum)
- FTT (Ftx)
- LINK (Link)
- LTC (Litecoin)
- LUNA (Terra)
- MANA (Decentraland)
- MATIC (Polygon)
- SAND (The Sandbox)
- SHIB (Shiba Inu)
- SOL (Solana)
- XRP (Ripple)
A very diversified basket, which allows us to identify the best crypto assets that respond to the continuation of the trend, be it bearish or bullish.
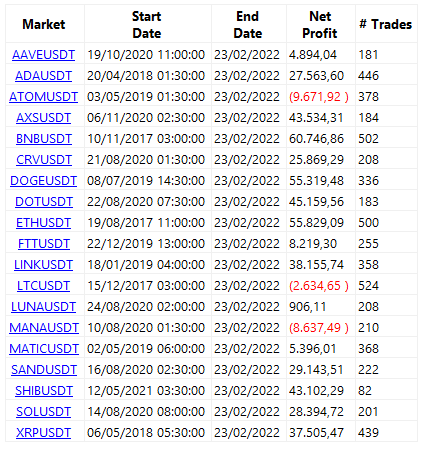
Figure 2 shows a summary table of the results obtained by varying the reference crypto. At a glance, it can be seen that the strategy seems to work on all markets. Clearly, the historical data provided on these cryptocurrencies is not uniform and this is the reason for the sometimes considerable difference in the number of trades made on individual altcoins.
Among the best is ETH which is defined as the most important altcoin of all and the second-largest crypto by capitalization. Then we see very positive results on BNB, but also on XRP and AXS. DOGE, the famous crypto endorsed by Elon Musk, also did very well.
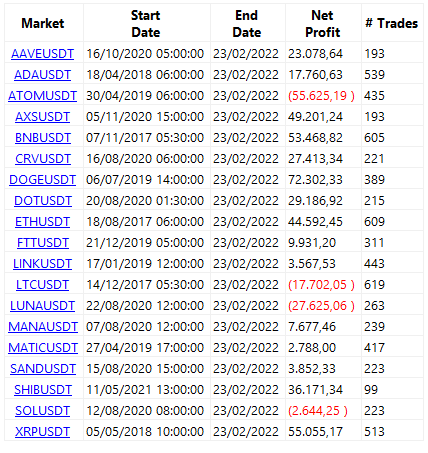
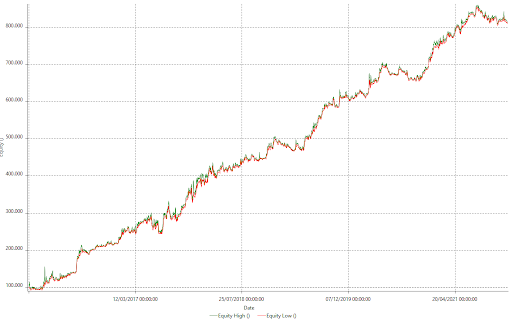
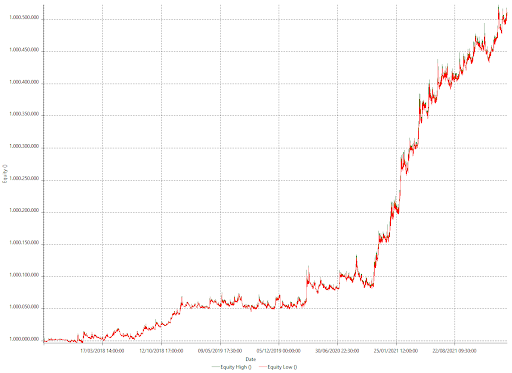
Figure 3 shows the cumulative profit curve generated by the overall portfolio. It is certainly very erratic and compared to the equity we saw on Bitcoin (Figure 4) we can see that altcoins are a younger market, and therefore also more “bubbly”.
If a fixed size of $10,000 per trade was set in the altcoin portfolio in order to see uniform results across all markets, the strategy on Bitcoin was tested with a fixed equity of $100,000. This is because since the underlying asset is worth more, a size at least equal to or greater than Bitcoin’s maximum price (around $68,000) had to be set in order to buy at least a single unit of Bitcoin.

At this point in the test we might consider adding a stop loss, which is a maximum risk threshold to be set for each trade, which if touched will automatically close the positions.
Once again, working on a very diversified basket, to standardize the tests we use the stop loss calculated as a percentage of the strategy’s entry price.
For example, by setting a maximum loss of 4% (which corresponds to $400) and adding a condition that you only enter the market if the previous day was an undecided day (more precisely if the so-called daily candle body is less than 50% of the total range of the day), the results take a decent step forward.
Figure 5 shows the curve generated on the altcoin portfolio with the addition of the stop loss. We continue to see the surge in the final phase of the backtest, due to a larger amount of data and therefore a larger amount of trades. Above all, going to see market by market (Figure 6) one sees that even markets on which money was previously lost are now positive. Such as SOL and LUNA.
The value of the average trade is $85, so about 0.85% on the average total position. If you look at the last two years alone, where backtesting is more uniform, then it is over $100.
It is also interesting to note that the backtests were carried out from January 1, 2016 until February 22, 2022. So up to the present day, those that have seen Bitcoin and especially altcoins plummet dramatically from what were historical highs. This “debacle” however would not have been triggered by trading with the automatic strategy shown above.
On the contrary, the automatic strategy would have continued to work in complete autonomy, regardless of any kind of emotions related to the collapses, and would have undoubtedly contended with the drawdowns we have seen recently in the altcoin market, even reaching new highs.
This strategy is therefore a great alternative that could certainly be enhanced and improved, with the inputs being tweaked and the best ones being chosen depending on the market. The good results seen on Bitcoin have been confirmed on a number of altcoins, supporting the thesis that cryptocurrencies tend to follow trends rather than reverse them.
Author: Andrea Unger
