Summary
Bitcoin Analysis
Bitcoin’s price bullishly engulfed its daily candle on Monday and closed its daily session +$1,339. Bullish BTC market participants have controlled much of BTC’s price action over the last ten days by percentage and BTC’s price closed Tuesday at its highest level since March 3rd.
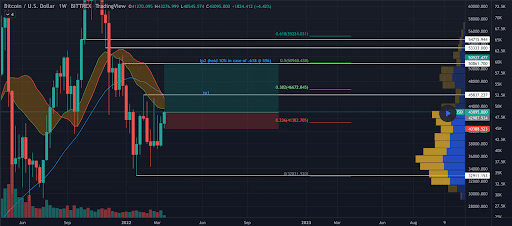
The first chart we’re analyzing today is the BTC/USD 1W chart below from metalhound. BTC’s price is trading between the 0.236 fibonacci level [$41,382.70] and 0.382 [$46,672.84], at the time of writing.
The primary target overhead for bullish BTC market participants is 0.382 followed by 0.5 [$50,948.43]. The third target overhead for bullish BTC traders is 0.618 [$55,224.03].
Conversely, bearish BTC traders are looking to again snap the 0.236 fib level with a secondary aim to push BTC’s price back down to retest 0 [$32,831.52].


Bitcoin’s Moving Averages: 5-Day [$41,515.67], 20-Day [$40,406.02], 50-Day [$40,453.66], 100-Day [$46,804.74], 200-Day [$45,813.44], Year to Date [$40,842.14].
BTC’s 24 hour price range is $40,936-$43,079 and its 7 day price range is $39,088-$43,079. Bitcoin’s 52 week price range is $29,341-$69,044.
The price of bitcoin on this date last year was $54,584.
The average price of BTC for the last 30 days is $40,154.
Bitcoin’s price [+3.26%] closed its daily candle worth $42,370 and in green figures for the first time in three days.
Ethereum Analysis
Ether’s price also charged higher on Tuesday and bullish traders reclaimed territory above the $3k level. ETH’s price concluded its daily session +$77.92 on Tuesday.
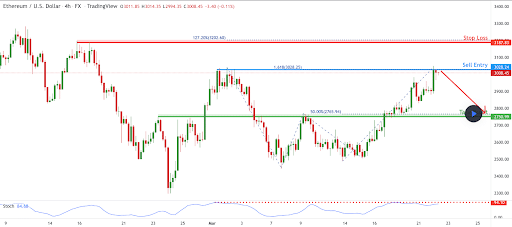
The ETH/USD 4HR chart below by FXCM show’s Ether’s price currently bumping up against the 1.618 fibonacci level [$3,028.25], at the time of writing.
The primary target of bullish Ether traders is the 1.618 fib level with a secondary target of 127.20% [$3,202.60].
From the perspective of bearish Ether traders, they’re aiming to reject bullish traders at the 1.618 and send ETH’s price back down to re-test 50.00% [$2,765.94]. Even if bullish Ether market participants close the daily timescale above the 1.618 fib level, they’ll need further confirmation with another daily candle close above that level on Wednesday to show they’re really in control of ETH’s short-term momentum.

ETH’s 24 hour price range is $2,890-$3,037 and its 7 day price range is $2,611-$3,037. Ether’s 52 week price range is $1,558-$4,878.
The price of ETH on this date in 2021 was $1,673.
The average price of ETH for the last 30 days is $2,722.
Ether’s price [+2.69%] closed its daily candle on Tuesday worth $2,969.68 and has finished in green digits for eight of the last nine days.
Polkadot Analysis
Polkadot’s price also climbed higher on Tuesday with the majority of blue chip cryptocurrency projects and bullishly engulfed its daily session [+$1.43].
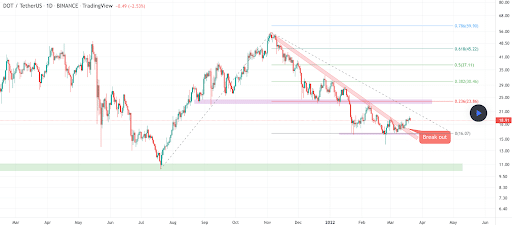
The third chart we’re analyzing today is the DOT/USDT 1D chart below from MohammadWaezi. Polkadot’s price is trading between 0 [$16.07] and 0.236 [$23.86], at the time of writing.
DOT’s price bounced after a full retracement at the $16 level and bullish DOT traders are now seeking to regain the 0.236 fib level. The next target to the upside for bullish traders is 0.382 [$30.46] followed by a third target of 0.5 [$37.11].
Bearish DOT traders are aiming to deny bullish traders the territory above the 0.236 fib level and seeking to send DOT’s price back down to retest the $16 level. If they’re successful at the 0 fib level the next target for bears is the $11 level which is the next major support zone for bullish traders.

Polkadot’s 24 hour price range is $18.7-$20.32 and its 7 day price range is $17.83-$20.32. DOT’s 52 week price range is $10.38-$54.98.
Polkadot’s price on this date last year was $34.29.
The average price of DOT over the last 30 days is $17.84.
Polkadot’s price [+7.62%] closed its session worth $20.19 and in green figures for the fourth time over five days.


