Bitcoin Analysis
Bitcoin’s price has alternated between green and red candles for the last ten days and when Monday’s daily bearish engulfing candle was painted, BTC’s price was -$951.
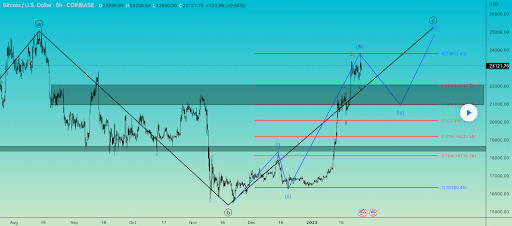
The BTC/USD 6HR chart by Cross10XSignals is where we’re leading-off today’s price analyses. BTC’s price is trading between the 0.236 fibonacci level [$22,046.12] and the 0 fib level [$23,802.42], at the time of writing.
Bullish traders of Bitcoin are on the brink of painting a massive bullish engulfing candle on the monthly time frame and bulls don’t want to concede any ground over the next day before the monthly candle’s painted. Their primary aim on the 6HR time frame is back to the peak of the recent bullish rally at the 0 fib level.
The chartist posits that BTC’s price may have just concluded its 3rd wave up and is now in a corrective wave on the 6HR timescale.
Contrariwise, bearish BTC traders want to send BTC’s price below the 0.236 fib level with a secondary target of 0.382 [$20,959.59]. The third target to the downside on BTC is the 0.5 fib level [$20,081.44]. If bearish traders can push BTC’s price below the 0.5 fib level they’ll need to break a major level of inflection at $20k to again retest the 0.618 fib level [$19,203.29].


Bitcoin’s Moving Averages: 5-Day [$23,170.42], 20-Day [$20,172.70], 50-Day [$18,150.42], 100-Day [$18,704.04], 200-Day [$22,017.97], Year to Date [$20,009.39].
BTC’s 24 hour price range is $22,500-$23,779 and its 7 day price range is $22,500-$23,779. Bitcoin’s 52 week price range is $15,505-$48,162.9.
The price of Bitcoin on this date last year was $38,480.9.
The average price of BTC for the last 30 days is $19,831.9 and its +39.8% over the same span.
Bitcoin’s price [-4.00%] closed its daily candle worth $22,795 on Monday.
Summary
Ethereum Analysis
Ether’s price followed the macro cryptocurrency market lower on Monday by more than 4% and was -$79.5 for the day.
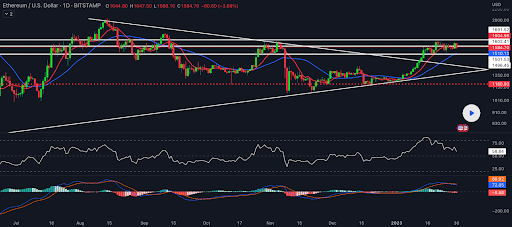
The ETH/USD 1D chart below from CryptoSanders9563 is the second chart we’re examining for this Tuesday. Ether’s price regained the $1,600 level last week and closed above that important level on Sunday.
We can see below that ETH’s price broke out of a huge triangle pattern and there appears to be some decent accumulation on ETH taking place before the market confirms whether there’s another leg up next for ETH or a step backwards.
The chartist posits that the mark-down in ETH’s price on Monday may have been contributed to by traders that took profits after ETH’s price closed near its highest level of the new year the day prior.

Ether’s Moving Averages: 5-Day [$1,601.04], 20-Day [$1,468.58], 50-Day [$1,322.33], 100-Day [$1,350.46], 200-Day [$1,534.69], Year to Date [$1,456.72].
ETH’s 24 hour price range is $1,535-$1,665 and its 7 day price range is $1,535-$1,655. Ether’s 52 week price range is $883.62-$3,579.96.
The price of ETH on this date last year was $2,686.66.
The average price of ETH for the last 30 days is $1,438.9 and its +33.17% for the same interval.
Ether’s price [-4.83%] closed its daily session on Monday worth $1,566.50. ETH’s also closed in red figures for four of the last five days.
Polkadot Analysis
Polkadot’s price was the worst performer of the projects covered today and DOT finished Monday’s trading session -$0.43.
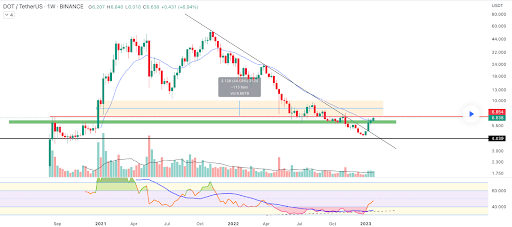
The DOT/USDT 1W chart below from FutureBlockchain is the chart we’re concluding our price analyses with today.
As we can see below, Polkadot’s price has broken a long-term downtrend and bulls are now attempting to regain the $7.00 level.
Bullish Polkadot traders have also successfully flipped DOT’s 21-EMA.

Polkadot’s Moving Averages: 5-Day [$6.35], 20-Day [$5.68], 50-Day [$5.27], 100-Day [$5.77], 200-Day [$7.33], Year to Date [$5.57].
Polkadot’s 24 hour price range is $6.02-$6.65 and its 7 day price range is $6.02-$6.69. DOT’s 52 week price range is $4.22-$23.85.
Polkadot’s price on this date in 2022 was $19.36.
The average price of DOT over the last 30 days is $5.47 and its +44.21% over the same duration.
Polkadot’s price [-6.52%] closed its daily candle worth $6.18 on Monday.


