Summary
Bitcoin Analysis
Bullish bitcoin traders are hoping for a reflexive rally after painting a green candle during Tuesday’s daily session. BTC’s price concluded Tuesday’s candle +$556.
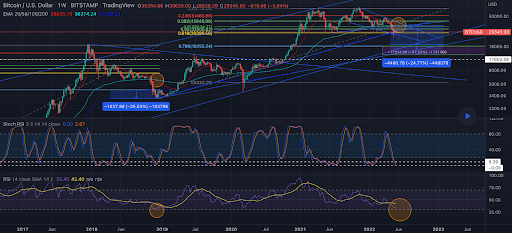
The first chart we’re looking at today is the BTC/USD 1W chart below from chungdha. BTC’s price is trading between 0.618 [$28,399.58] and 0.5 [$35,524.77], at the time of writing.
The obvious initial barrier for bullish traders is the 0.5 fib level followed by targets of 0.382 [$42,649.96] and 0.236 [$51,465.88].
Bearish traders are looking to do the polar opposite, they’re aiming to snap the 0.618 with candle close confirmation on this timescale and then go to test the 0.786 fib level [$18,255.24].
There’s a third target of 1 [$5,333.29] to the downside. If bitcoin becomes extremely oversold and there’s a larger macro breakdown of the legacy market perhaps that’s one way to reach four figure BTC again.
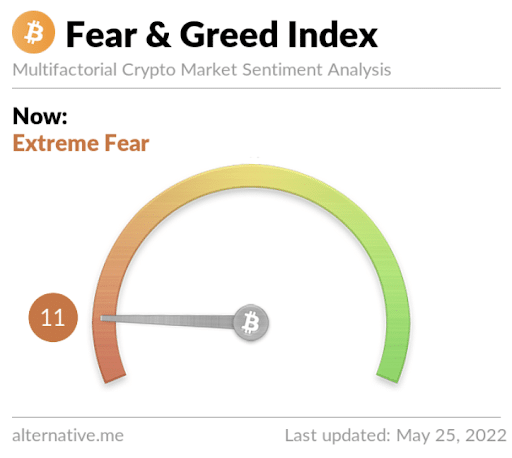
Bitcoin’s Moving Averages: 5-Day [$29,416.46], 20-Day [$33,086.32], 50-Day [$38,799.17], 100-Day [$39,680.91], 200-Day [$46,205.66], Year to Date [$39,807.67].
BTC’s 24 hour price range is $28,715-$29,785 and its 7 day price range is $28,715-$30,546. Bitcoin’s 52 week price range is $26,600-$69,044.
The price of Bitcoin on this date last year was $38,363.
The average price of BTC for the last 30 days is $33,766.2 and BTC’s -25.8% over the same duration.
Bitcoin’s price [+1.91%] closed its daily candle worth $29,647 and in green figures for the third time over the last four days.
Ethereum Analysis
Ether’s price also finished a bit higher when traders settled up on Tuesday than on Monday and ETH’s price concluded the day +$6.42.
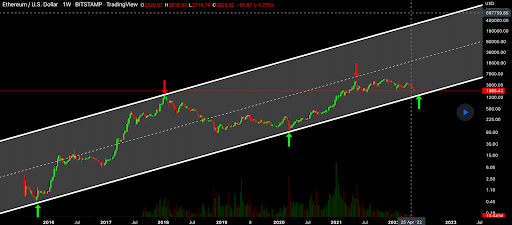
The ETH/USD 1W chart below by ZhongBenCong001 shows Ether’s price trading at the bottom of a historical uptrend. If bullish traders lose the $1,700 level the next level of defense is the $1,400 level on the weekly time frame.
Below the $1,400 level market participants could see ETH potentially markdown by nearly 50%. That would take ETH’s price down to test the $700-$800 level as support. Below that level there’s further historical support for bullish ETH market participants between the $400-$500 level.
Ether’s Moving Averages: 5-Day [$1,980.06], 20-Day [$2,361.86], 50-Day [$2,813.19], 100-Day [$2,839.71], 200-Day [$3,336.54], Year to Date [$2,858.08].
ETH’s 24 hour price range is $1,916-$1,992 and its 7 day price range is $1,915-$2,095. Ether’s 52 week price range is $1,719-$4,878.
The price of ETH on this date in 2021 was $2,704.9.
The average price of ETH for the last 30 days is $2,415.46 and ETH’s -33.2% over the same timespan.
Ether’s price [+0.33%] closed its daily candle on Tuesday worth $1,949.4 and ETH’s also concluded three of the last four days with a green candle.
ADA Analysis
Cardano’s price rallied nearly 2% on Tuesday and finished its daily candle +$0.009.
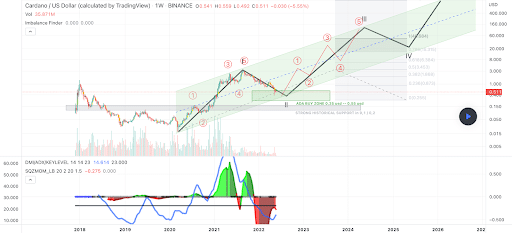
The ADA/USD 1W chart below from euzimc shows ADA’s price trading between a potentially strong accumulation zone. That zone is between the 0 fib level [$0.255] and 0.236 [$0.873], at the time of writing.
The primary target overhead for bullish traders is 0.236 followed by 0.382 [$1.868], and 0.5 [$3.453].
The last target to the downside for bearish traders to crack before they create a prolonged downtrend is 0 [$0.255].
ADA’s price is -65.91% against The U.S. Dollar for the last 12 months, -55.8% against BTC, and -55.59% against ETH over the same duration.
Cardano’s 24 hour price range is $0.495-$0.524 and its 7 day price range is 0.495-$0.577. ADA’s 52 week price range is $0.403-$3.09.
Cardano’s price on this date last year was $1.55.
The average price of ADA over the last 30 days is $0.672 and ADA’s -41.4% over the same timespan.
Cardano’s price [+1.77%] closed its daily session on Tuesday worth $0.521 and like BTC and ETH has finished three of the last four daily sessions in green figures.


