Summary
Bitcoin Analysis
Bullish BTC market participants failed to regain the $21k level during Monday’s daily session and BTC’s price finished in red figures [-349] for a second consecutive day.
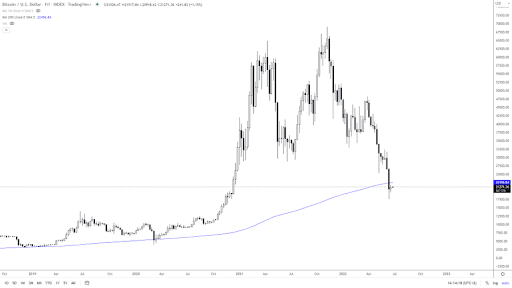
The first chart we’re analyzing for Tuesday is the BTC/USD 1W chart below from @MultichainFunds.
Monday marked the first time in the history of BTC that its price traded for an entire week below the 200 MA on the weekly timescale. If bullish BTC market participants fail to reestablish price action above that level a retest of the $17k level over time could be imminent.
Conversely, if bullish traders are able to regain the 200 MA their next target is the $28k level. That would likely lead price action back to the $28k-$32k level where market participants may find out a lot more about what they can expect for the short-term and midterm for bitcoin.

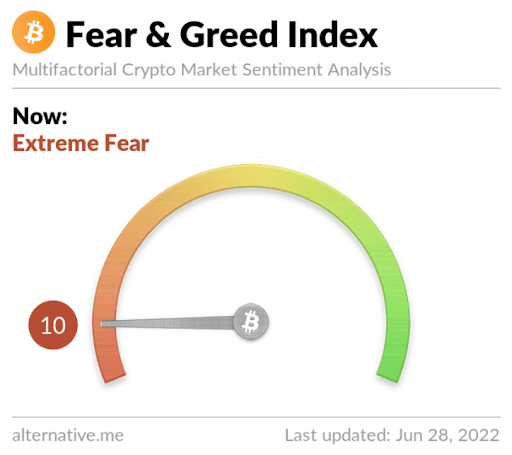
The Fear and Greed Index is 10 Extreme Fear and is -2 from Monday’s reading of 12 Extreme Fear.

Bitcoin’s Moving Averages: 5-Day [$20,788.04], 20-Day [$25,312.76], 50-Day [$30,570.48], 100-Day [$36,271.77], 200-Day [$43,634.94], Year to Date [$37,190.37].
BTC’s 24 hour price range is $20,515-$21,534 and its 7 day price range is $19,864-$21,637. Bitcoin’s 52 week price range is $17,611-$69,044.
The price of Bitcoin on this date last year was $34,484.
The average price of BTC for the last 30 days is $25,700.3 and its -27.3% for the same time frame.
Bitcoin’s price [-1.66%] closed its daily candle worth $20,718 and in red figures for a second consecutive day.
Ethereum Analysis
Ether’s price also finished lower on Monday and when traders settled up at its session close ETH was -$6.95.
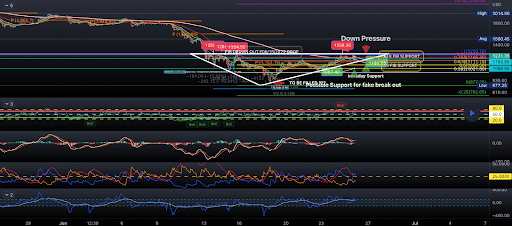
Today’s second chart of emphasis is the ETH/USD 90M chart below by Michael_StClaire. ETH’s price is trading between 0.764 [$1,166.4] and 1 [$1,255.7], at the time of writing.
The primary overhead target for bullish Ether traders is 1 [$1,255.7] followed by a retest of ETH’s 2018 high above the $1,4k level.
Bearish traders are still arguably in control despite bullish traders recently winning a few battles – their targets to the downside of the chart are 0.764 [$1,166.4], 0.618 [$1,111.15], and 0.5 [$1,066.50].

ETH’s 24 hour price range is $1,172-$1,238 and its 7 day price range is $1,049-$1,265. Ether’s 52 week price range is $883.62-$4,878.
The price of ETH on this date in 2021 was $2,084.6.
The average price of ETH for the last 30 days is $1,482.93 and its -32.26% over the same duration.
Ether’s price [-0.58%] closed its daily candle on Monday worth $1,190.87 and in red digits for a second straight day.
XRP Analysis
XRP’s price also dropped lower to begin the new week and XRP closed its daily candle -$0.006.
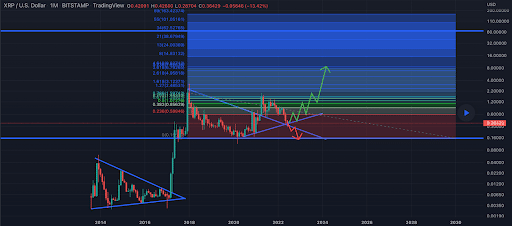
The XRP/USD 1M chart below from ALTCOIN_BEAST shows two possible scenarios for XRP’s price over the short-term.
Bullish traders are seeking a return to prices back above the 0.236 fibonacci level [$0.588]. If they’re successful at that level their secondary aim is 0.382 [$0.856] followed by a third target of 0.5 [$1.07].
Non-believers of the recent rally on XRP have their sights firstly on pushing XRP’s price back below $0.30. If they can send XRP below that level they’ll shift their focus to breaking $0.20 with an eventual target of a full fibonacci retracement back to 0 [$0.155].

XRP’s Moving Averages: 5-Day [$0.34], 20-Day [$0.361], 50-Day [$0.464], 100-Day [$0.623], 200-Day [$0.778], Year to Date [$0.641].
XRP’s 24 hour price range is $0.348-$0.367 and its 7 day price range is $0.32-$0.381. Ripple’s 52 week price range is $0.287-$1.41.
XRP’s price on this date last year was $0.733.
The average price of XRP over the last 30 days is $0.364 and its -10.49% for the same time frame.
XRP’s price [-1.59%] closed its daily session on Monday worth $0.353 and in red figures for a second consecutive day as well.


