Summary
Bitcoin Analysis
Bitcoin’s price finished in negative digits for a third consecutive daily session and BTC concluded its daily frame on Tuesday -$451.
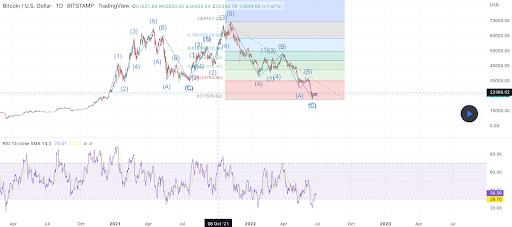
The BTC/USD 1D chart below from Zrroon shows BTC’s price trading between the 0 fibonacci level [$17,635.82] and 0.236 [$29,793.45], at the time of writing.
Traders that are still optimistic in a mid-term rally on BTC are looking to send BTC’s price back above the 0.236 fib with a secondary target of 0.382 [$37,314.7]. The third target overhead for bitcoin bulls is 0.5 [$43,303.52].
Conversely, traders that are bearish on BTC in the short-term to midterm are looking to push BTC’s price back below the $20k level with a secondary target of BTC’s multi-year low of $17,611.


Bitcoin’s Moving Averages: 5-Day [$20,706.62], 20-Day [$24,745.54], 50-Day [$30,153.22], 100-Day [$36,033.72], 200-Day [$43,532.41], Year to Date [$37,058.43].
BTC’s 24 hour price range is $20,138-$21,208 and its 7 day price range is $19,864-$21,637. Bitcoin’s 52 week price range is $17,611-$69,044.
The price of Bitcoin on this date last year was $35,895.9.
The average price of BTC for the last 30 days is $25,435.9 and its -27.8% over the same duration.
Bitcoin’s price [-2.18%] closed its daily candle worth $20,267 on Tuesday.
Ethereum Analysis
Ether’s price also finished in negative figures for a third consecutive day and ETH concluded its daily session -$46.85.
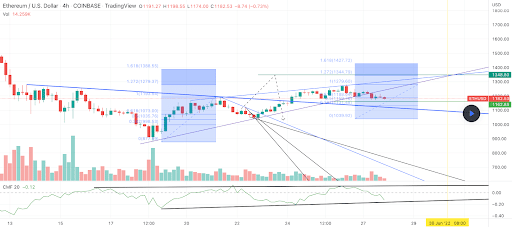
The second chart we’re looking at for Wednesday is the ETH/USD 4HR chart below by JabezDolz. Ether’s price is trading between 0.5 [$1,159.76] and 0.618 [$1,188.04], at the time of writing.
Bulls have their sights on sending ETH back above the 0.618 fib level with a secondary target of 1 [$1,279.6] and 1.272 [$1,344.79].
Bearish market participants on the other hand are looking to push ETH’s price back down to retest the 0 fib level followed by the $1k level.

ETH’s 24 hour price range is $1,133.03-$1,237.99 and its 7 day price range is $1,049.65-$1,265.94. Ether’s 52 week price range is $883.62-$4,878.
The price of ETH on this date in 2021 was $2,382.29.
The average price of ETH for the last 30 days is $1,465.53 and its -30.9% over the same time frame.
Ether’s price [-3.93%] closed its daily candle on Tuesday worth $1,144.02.
FTT [FTX] Analysis
The third chart we’re analyzing today is the FTX/USD 1D chart below from EdgarTigranyan. This chart shows FTT’s price backtesting a descending wedge breakout.
If the backtest is successful the target price on FTT is the $40 level. However, if bullish FTT traders fail to confirm that the breakout is real, they’ll find themselves back inside a larger pattern with more potential downside forthcoming.
![FTT [FTX] Analysis](https://cryptonomist.ch/wp-content/uploads/2022/06/unnamed-2-8.png)
FTT’s 24 hour price range is $25.45-$27.8 and its 7 day price range is $25.16-$28.83. FTT’s 52 week price range $21.06-$72.91.
The average price of FTT over the last 30 days is $26.54 and its -1.09% for the same timespan.
FTT’s price [-5.56%] closed its daily session on Tuesday worth $25.63 and it’s also finished in negative figures for three straight days.


