Trading through the bias on Bitcoin? In this article we are going to try to find out as much as we can about the monthly bias of the world’s best-known cryptocurrency: bitcoin.
Monthly bias refers to the average price trend of Bitcoin during the days of the month. Using proprietary software, it is possible to calculate this bias and note the presence of recurring trends within the month.
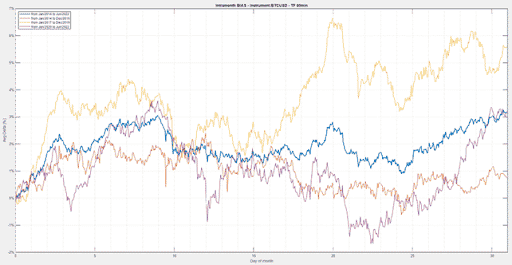
Specifically, Figure 1 shows the results of Unger Academy’s proprietary software, the Bias Finder, which analyzes how the price of Bitcoin moved on average during the month by considering the following intervals:
- 24 months from January 2014 to December 2016 (orange line)
- 24 months from January 2017 to December 2019 (yellow line)
- 24 months from January 2020 to December 2022 (purple line)
- The average of all available history 2014-2022 (blue line)

What seems to emerge from these studies is that between the end and beginning of each month there seems to be a clear upward trend. More specifically, we can see that starting from the 25th day of each month until the first 2-3 days of the following month, there is a certain constancy to rise. This bias, or behavior, has remained stable over the intervals considered, with only a slight regression from the average. During the rest of the month, on the other hand, there is on average a phase of laterality, with deviations too far from the average to be taken into account.
So is it worth buying Bitcoin at the end of the month and holding it until the beginning of the next month? What might be the reason for this recurring behavior?
To find out, it is necessary to carry out appropriate tests.
It will be enough to test the rules just described by the Bias Finder to be able to put down on paper whether or not the idea might also be attractive for live trading.
Certainly the idea generates suggestions right from the start in that this bias, and in particular the one concerning the first days of the month, seems to take on a truly enviable constancy. As mentioned earlier, the curves divided by intervals do not deviate too much from the average. It certainly seems that many investors decide to allocate a portion of their capital in Bitcoin in the first few days of the month. For convenience perhaps? Could be, but there is no certainty until the results are validated.
To do this, simple instructions are written, according to which one buys Bitcoin on the stroke of the 25th of each month, and then closes the position at the opening of the third day of the following month. The duration of the trades made will be about 9-10 days, and a single trade will be made per month, for all months of the year.
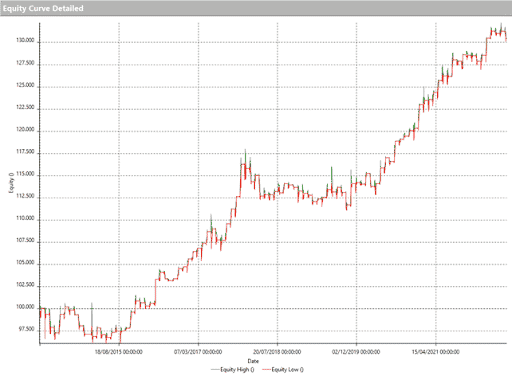
The results, visible in Figure 2, are encouraging right from the start. Keep in mind that at the moment the strategy does not use any stoploss and takeprofit, but simply closes the position after a maximum of 10 days. This allows for a better evaluation of the bias idea, but should one wish to trade with this type of strategy, the use of stoploss is recommended.

The trade size was calculated as a fixed monetary amount, specifically $10,000 for each position.
Judging from the profit curve, it can be seen that the strategy has not always worked consistently, and this is evidenced by difficult moments such as in 2018 or at the beginning of the backtest in 2014. Nevertheless, for the time being the strategy seems to have reacted very well to the large drawdown (-75%) seen by Bitcoin in the first 6 months of 2022.
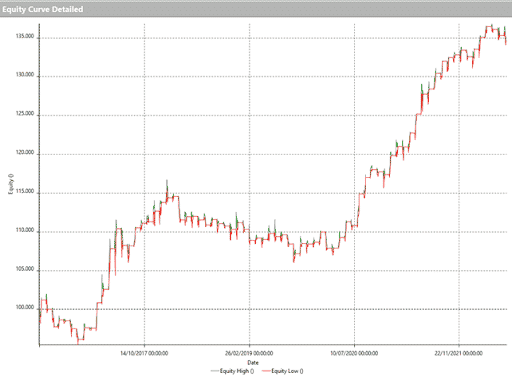
As a further test, to assess the validity of the idea, we proceed to test this strategy on another cryptocurrency: Ethereum. In this case the data for the backtest will start later, June 2016. In Figure 3 we see that the equity line is not as nice as the previous one, and it appears that with this asset the strategy took longer to recover from the drawdown seen in 2018.

Nevertheless, the results are comforting here as well, the strategy generated profits, even higher than those of Bitcoin, in less time, and most importantly reducing the impact of the drawdowns seen on these markets.
The conclusion is that this strategy could never replicate the huge profit that could have been accumulated by holding these assets for the entire period considered, but it would have saved very difficult moments to sustain (because one would have been out of the market).
Happy trading!
Andrea Unger


