
Summary
Bitcoin Analysis
Bitcoin’s price finished in green figures just marginally on Sunday for the third time over the last four days and when traders settled-up on Sunday BTC was +$65.8.
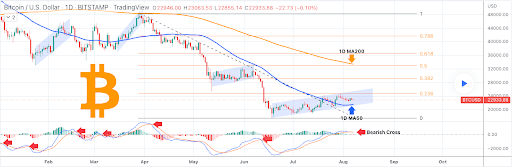
This Monday we’re leading off a new week of price analyses with the BTC/USD 1D chart below from TradingShot. BTC’s price is trading between the 0 fibonacci level [$17,575.95] and 0.236 [$24,813.07], at the time of writing.
Bitcoin’s price has been in a tight range dating back to mid-July and that continued over the weekend. The primary target for bullish traders to snap this range is 0.236. That level has been highly respected as overhead support thus far during the recent bullish rally. The secondary target overhead for bullish bitcoin market participants is 0.382 [$29,344.78] with a third target of 0.5 [$32,926.3].
Bearish traders have another vision, that vision is to again send BTC’s price back below the $20k level and to retest 12-month lows at the 0 fibonacci level before inflicting further damage and a new low.
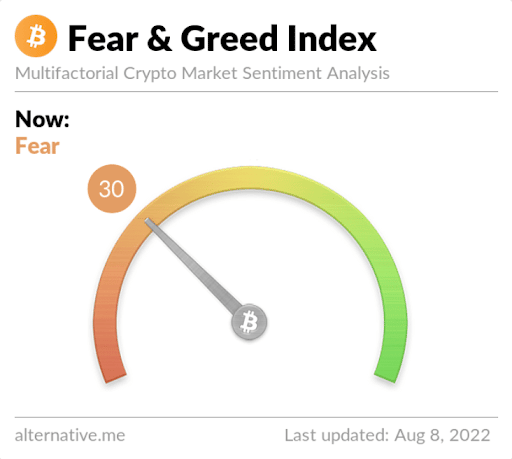
The Fear and Greed Index is 30 Fear and is equal to Sunday’s reading.
Bitcoin’s Moving Averages: 5-Day [$22,978.78], 20-Day [$22,186.76], 50-Day [$23,271.88], 100-Day [$30,679.27], 200-Day [$38,942.00], Year to Date [$34,271.65].
BTC’s 24 hour price range is $22,836-$23,435 and its 7 day price range is $22,526-$23,561. Bitcoin’s 52 week price range is $17,611-$69,044.
The price of bitcoin on this date last year was $43,770.
The average price of BTC for the last 30 days is $22,175.3 and its +12.6% over the same time frame.
Bitcoin’s price [+0.28%] closed its daily candle worth $23,177.9 on Sunday.
Ethereum Analysis
Ether’s price closed in positive figures for the second time over the last three days on Sunday and +$9.71.
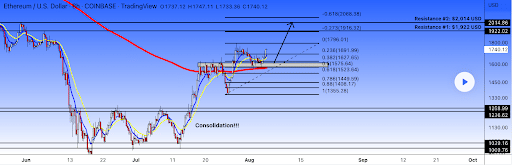
The second chart this Monday for analysis is the ETH/USD 8HR chart below by harisonhbn9718. ETH’s price is trading between the 0.236 fib level [$1,691.99] and 0 [$1,796.01].
Bullish Ether traders have been rejected numerous times at the $1,8k level and they need to overcome it to spark a larger mid-term rally. The targets above that level are -0.273 [$1,916.32] and -0.618 [$2,068.38].
Conversely, bearish traders that are short the ETH market are targeting 0.236, 0.382 [$1,627.65], and 0.5 [$1,575.64] next.
Ether’s Moving Averages: 5-Day [$1,637.93], 20-Day [$1,478.05], 50-Day [$1,414.58], 100-Day [$2,083.92], 200-Day [$2,793.81], Year to Date [$2,372.83].
ETH’s 24 hour price range is $1,668-$1,729 and its 7 day price range is $1,574-$1,738. Ether’s 52 week price range is $883.62-$4,878.
The price of ETH on this date in 2021 was $3,013.69.
The average price of ETH for the last 30 days is $1,471.38 and its +43.8% over the same duration.
Ether’s price [+0.57%] closed its daily candle on Sunday worth $1,700.27.
Polkadot Analysis
Polkadot’s price closed at its highest level on the weekly time frame since May 30th on Sunday and concluded its daily trading session +$0.022.
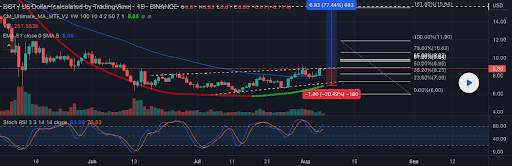
The third project we’re looking at today is Polkadot and the DOT/USD 1D chart below from EdgarTigranyan. DOT’s price is trading between 38.20% [$8.25] and 50.00% [$8.95], at the time of writing.
The targets on DOT overhead are 50.00%, 61.80% [$9.64], and 78.60% [$10.63].
At variance with bulls are bearish traders looking to put an end to the recent bullish momentum. The targets to the downside for bearish Polkadot market participants are 38.20%, 23.60%, and a full retracement back to 0.00% [$6.00].
Polkadot’s Moving Averages: 5-Day [$8.2], 20-Day [$7.43], 50-Day [$7.82], 100-Day [$12.00], 200-Day [$19.81], Year to Date [$14.98].
DOT’s price is +22.85% against The U.S. Dollar over the last 30 days, +13.28% against BTC, and -13,47% against ETH, over the same duration.
Polkadot’s 24 hour price range is $8.34-$8.92 and its 7 day price range is $7.72-$8.92. DOT’s 52 week price range is $6.04-$54.98.
Polkadot’s price on this date last year was $19.66.
The average price of DOT over the last 30 days is $7.5 and its +24.62% over the same timespan.
Polkadot’s price [+0.26%] closed its daily session worth $8.68 on Sunday and it has finished in green figures five times over the last six days.