Summary
Bitcoin Analysis
Bitcoin’s price was controlled again by bearish traders on Wednesday and when market participants settled-up on BTC at 12:00 UTC, BTC’s price was -$238.
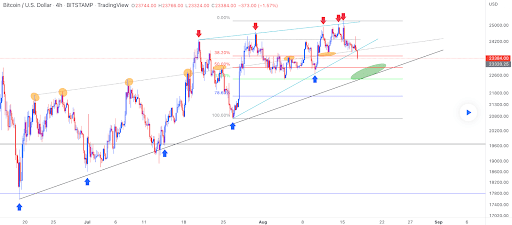
The first chart we’re analyzing today is the BTC/USD 4HR chart below from mirac1e. BTC’s price is trading between the 50.00% fibonacci level [$22,963.1] and 38.20 [$23,503.3], at the time of writing.
The overhead target for BTC bulls are 38.20% and a full-retracement back to 0.00% [$25,219.11].
Conversely, the bearish targets below on bitcoin are the 50.00% fib level, followed by 61.80% [$22,451.13], and 78.60% [$21,673.93].

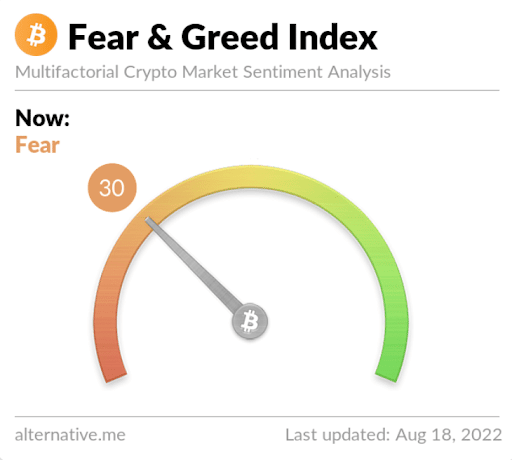
The Fear and Greed Index is 30 Fear and is -11 from Wednesday’s reading of 41 Fear.

Bitcoin’s Moving Averages: 5-Day [$23,986.65], 20-Day [$23,280.31], 50-Day [$22,182.56], 100-Day [$29,016.48], 200-Day [$37,361.56], Year to Date [$33,761.68].
BTC’s 24 hour price range is $23,170-$24,440 and its 7 day price range is $23,170-$24,995.08. Bitcoin’s 52 week price range is $17,611-$69,044.
The price of bitcoin on this date last year was $45,015.47.
The average price of BTC for the last 30 days is $23,100.9 and its +12% over the same duration.
Bitcoin’s price [-0.99%] closed its daily candle worth $23,856 and in red figures for a third straight day.
Ethereum Analysis
Ether’s price traded more than 1% lower on Wednesday and it closed -$23.57.
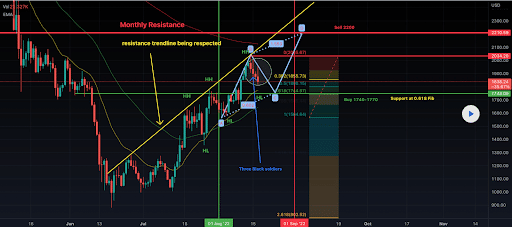
The second chart today is the ETH/USD 4HR chart below by maberl. ETH’s price is trading between the 0.5 fib level [$1,800.15] and 0.382 [$1,855.73], at the time of writing.
Bullish ETH traders were rejected harshly a number of times at the $2k level and are looking to hold the 0.50 as support before mustering another rally to the upside yet again. The targets overhead for ETH bulls are 0.382 and a full-retracement back to ETH’s recent high of 0 [$2,015.67].
At variance with Ether bulls are those that are still short the Ether market. The targets below are 0.382, 0.5 [$1,800.15], and 0.618 [$1,744.57].

Ether’s Moving Averages: 5-Day [$1,891.69], 20-Day [$1,704.58], 50-Day [$1,4141.98], 100-Day [$1,978.28], 200-Day [$2,685.14], Year to Date [$2,347.13].
ETH’s 24 hour price range is $1,818.74-$1,959.43 and its 7 day price range is $1,818.74-$2,024.5. Ether’s 52 week price range is $883.62-$4,878.
The price of ETH on this date in 2021 was $3,007.14.
The average price of ETH for the last 30 days is $1,675.03 and its +49.76 over the same time frame.
Ether’s price [-1.24%] closed Wednesday’s daily trading session worth $1,876.68 and in red figures for a third consecutive day.
Filecoin Analysis
Filecoin’s price also traded lower on Wednesday and when traders settled up, FIL was -$0.01.
The last chart for analysis today is the FIL/USD 4HR chart below from ronzo777. Filecoin’s price is trading at support inside a large bullish pennant.
Bullish FIL traders need to maintain support at the $8.03 level. If they manage to do that and get help from bitcoin, they’ll have the opportunity to break out of the bullish pennant at the $8.56 level.

Filecoin’s Moving Averages: 5-Day [$8.39], 20-Day [$7.38], 50-Day [$6.34], 100-Day [$10.27], 200-Day [$20.70], Year to Date [$14.98].
FIL’s price is -88.37% against The U.S. Dollar over the last 12 months, -77.73% against BTC, and -80.91% against ETH, over the same time frame.
Filecoin’s 24 hour price range is $7.96-$8.9 and its 7 day price range is $7.96-$8.93. FIL’s 52 week price range is $4.81-$119.95.
Filecoin’s price on this date last year was $69.42.
The average price of FIL over the last 30 days is $7.29 and its +58.13% over the same timespan.
Filecoin’s price [-0.12%] closed its daily trading session on Wednesday worth $8.43 and in red figures for the third time over the last four days.


