Summary
Bitcoin Analysis
Bitcoin’s price regained the $17k level during Wednesday’s trading session and when the day’s candle was printed, BTC’s price was +$722.3.
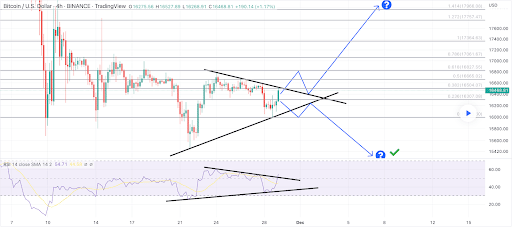
The first chart we’re analyzing for this Thursday is the BTC/USD 4HR chart below from Altin35. BTC’s price is trading between the 0.5 fibonacci level [$16,665.02] and 0.618 [$16,827.55], at the time of writing.
Overhead bullish traders are seeking to once again climb above the 1 fib level [$17,364.63], followed by targets of 1.272 [$17,757.47], and the 1.414 fib level [$17,966.08].
Bearish traders are attempting to stall the current bullish momentum and again send BTC’s price below the 0.5 fib level. The secondary target for bears is 0.382 [$16,504.07] followed by a third target of 0.236 [$16,307.08] and a fourth fib target of 0 [$15,993.60].
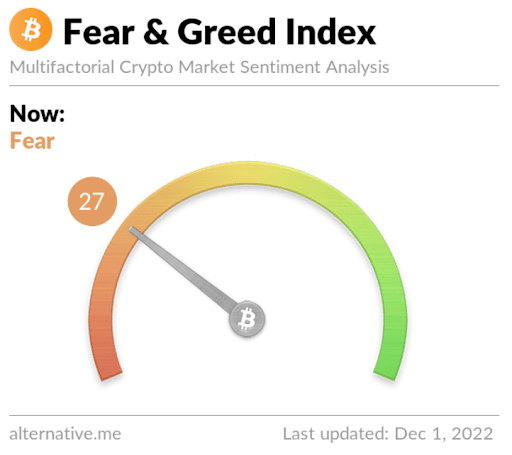
Bitcoin’s Moving Averages: 5-Day [$16,507.09], 20-Day [$17,248.72], 50-Day [$18,680.86], 100-Day [$20,193.65], 200-Day [$26,949.12], Year to Date [$29,190.13].
BTC’s 24 hour price range is $16,426.2-$17,249 and its 7 day price range is $16,143.63-$17,227.39. Bitcoin’s 52 week price range is $15,501-$59,055.
The price of Bitcoin on this date last year was $57,197.7.
The average price of BTC for the last 30 days is $17,868.2 and its -18.2% over the same interval.
Bitcoin’s price [+4.39%] closed its daily candle worth $17,163.3 and in positive figures for a second consecutive day.
Ethereum Analysis
Ether’s price also rallied higher on Wednesday and concluded its daily candle +$77.85.
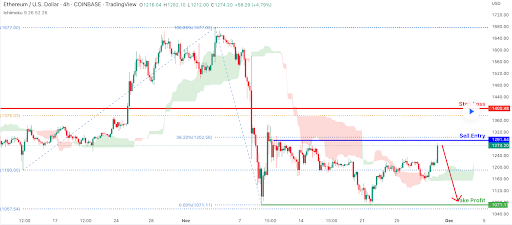
The ETH/USD 4HR chart below by desmondlzw is the second chart we’re examining today. At the time of writing, ETH’s price is trading between the 0.00% fib level [$1,071.11] and 38.20% fibonacci level [$1,302.56].
The targets therefore overhead for bullish Ether traders begin with the 38.20% fib level and the secondary target is 100.00% [$1,677.00].
Conversely, bearish traders are attempting to again send ETH’s price back down to retest the 0.00% fib level before attempting to send it to a three figure valuation.
ETH’s 24 hour price range is $1,212.5-$1,309.77 and its 7 day price range is $1,163.39-$1,309.77. Ether’s 52 week price range is $883.62-$4,778.
The price of ETH on this date in 2021 was $4,582.96.
The average price of ETH for the last 30 days is $1,323.71 and its -18.73% for the same stretch.
Ether’s price [+6.40%] closed its daily candle on Wednesday valued at $1,294.39 and in green digits for a second straight day.
Avalanche Analysis
Avalanche’s price broke back into green figures for the first time in three days on Wednesday and finished the day +$0.69.
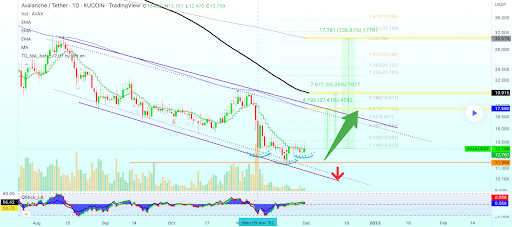
The AVAX/USDT 1D chart by AlanSantana is the last chart we’re looking at for this Thursday. At the time of writing, Avalanche’s price is trading between the 0.148 fibonacci level [$12.825] and 0.236 [$13.631].
The overhead targets for bullish traders of the AVAX market are 0.236, 0.382 [$14.969], 0.5 [$16.051], 0.618 [$17.132] and the 0.786 fib level [$18.671] over the short-term.
At variance with bullish traders are those that still believe AVAX’s price has further downside yet. Their targets are to again test the 0.148 fib level before ultimately retesting its 12-month low of $11.49.
Avalanche price on this date last year was $119.59.
The average price of AVAX over the last 30 days is $14.78 and its -21.28% over the same span.
Avalanche’s price [+5.54%] closed its trading session on Wednesday worth $13.16.


