

Coinbase stock is trading with a cautiously constructive tone, but the bigger picture still stops short of a clean bullish breakout. Restructuring news has improved sentiment, and COIN has regained near-term control. However, the stock remains below a key long-term trend ceiling.
Summary
Coinbase stock reaction to restructuring news
Notably, today’s move is supported by a clear company-specific catalyst. Headlines about Coinbase cutting roughly 14% of staff and restructuring around AI-native teams have been received positively by the market. The stock is higher on the session.
That matters because Coinbase stock is reacting to fresh information with a constructive bid rather than fading the news. Even so, a one-day move does not settle the medium-term trend.
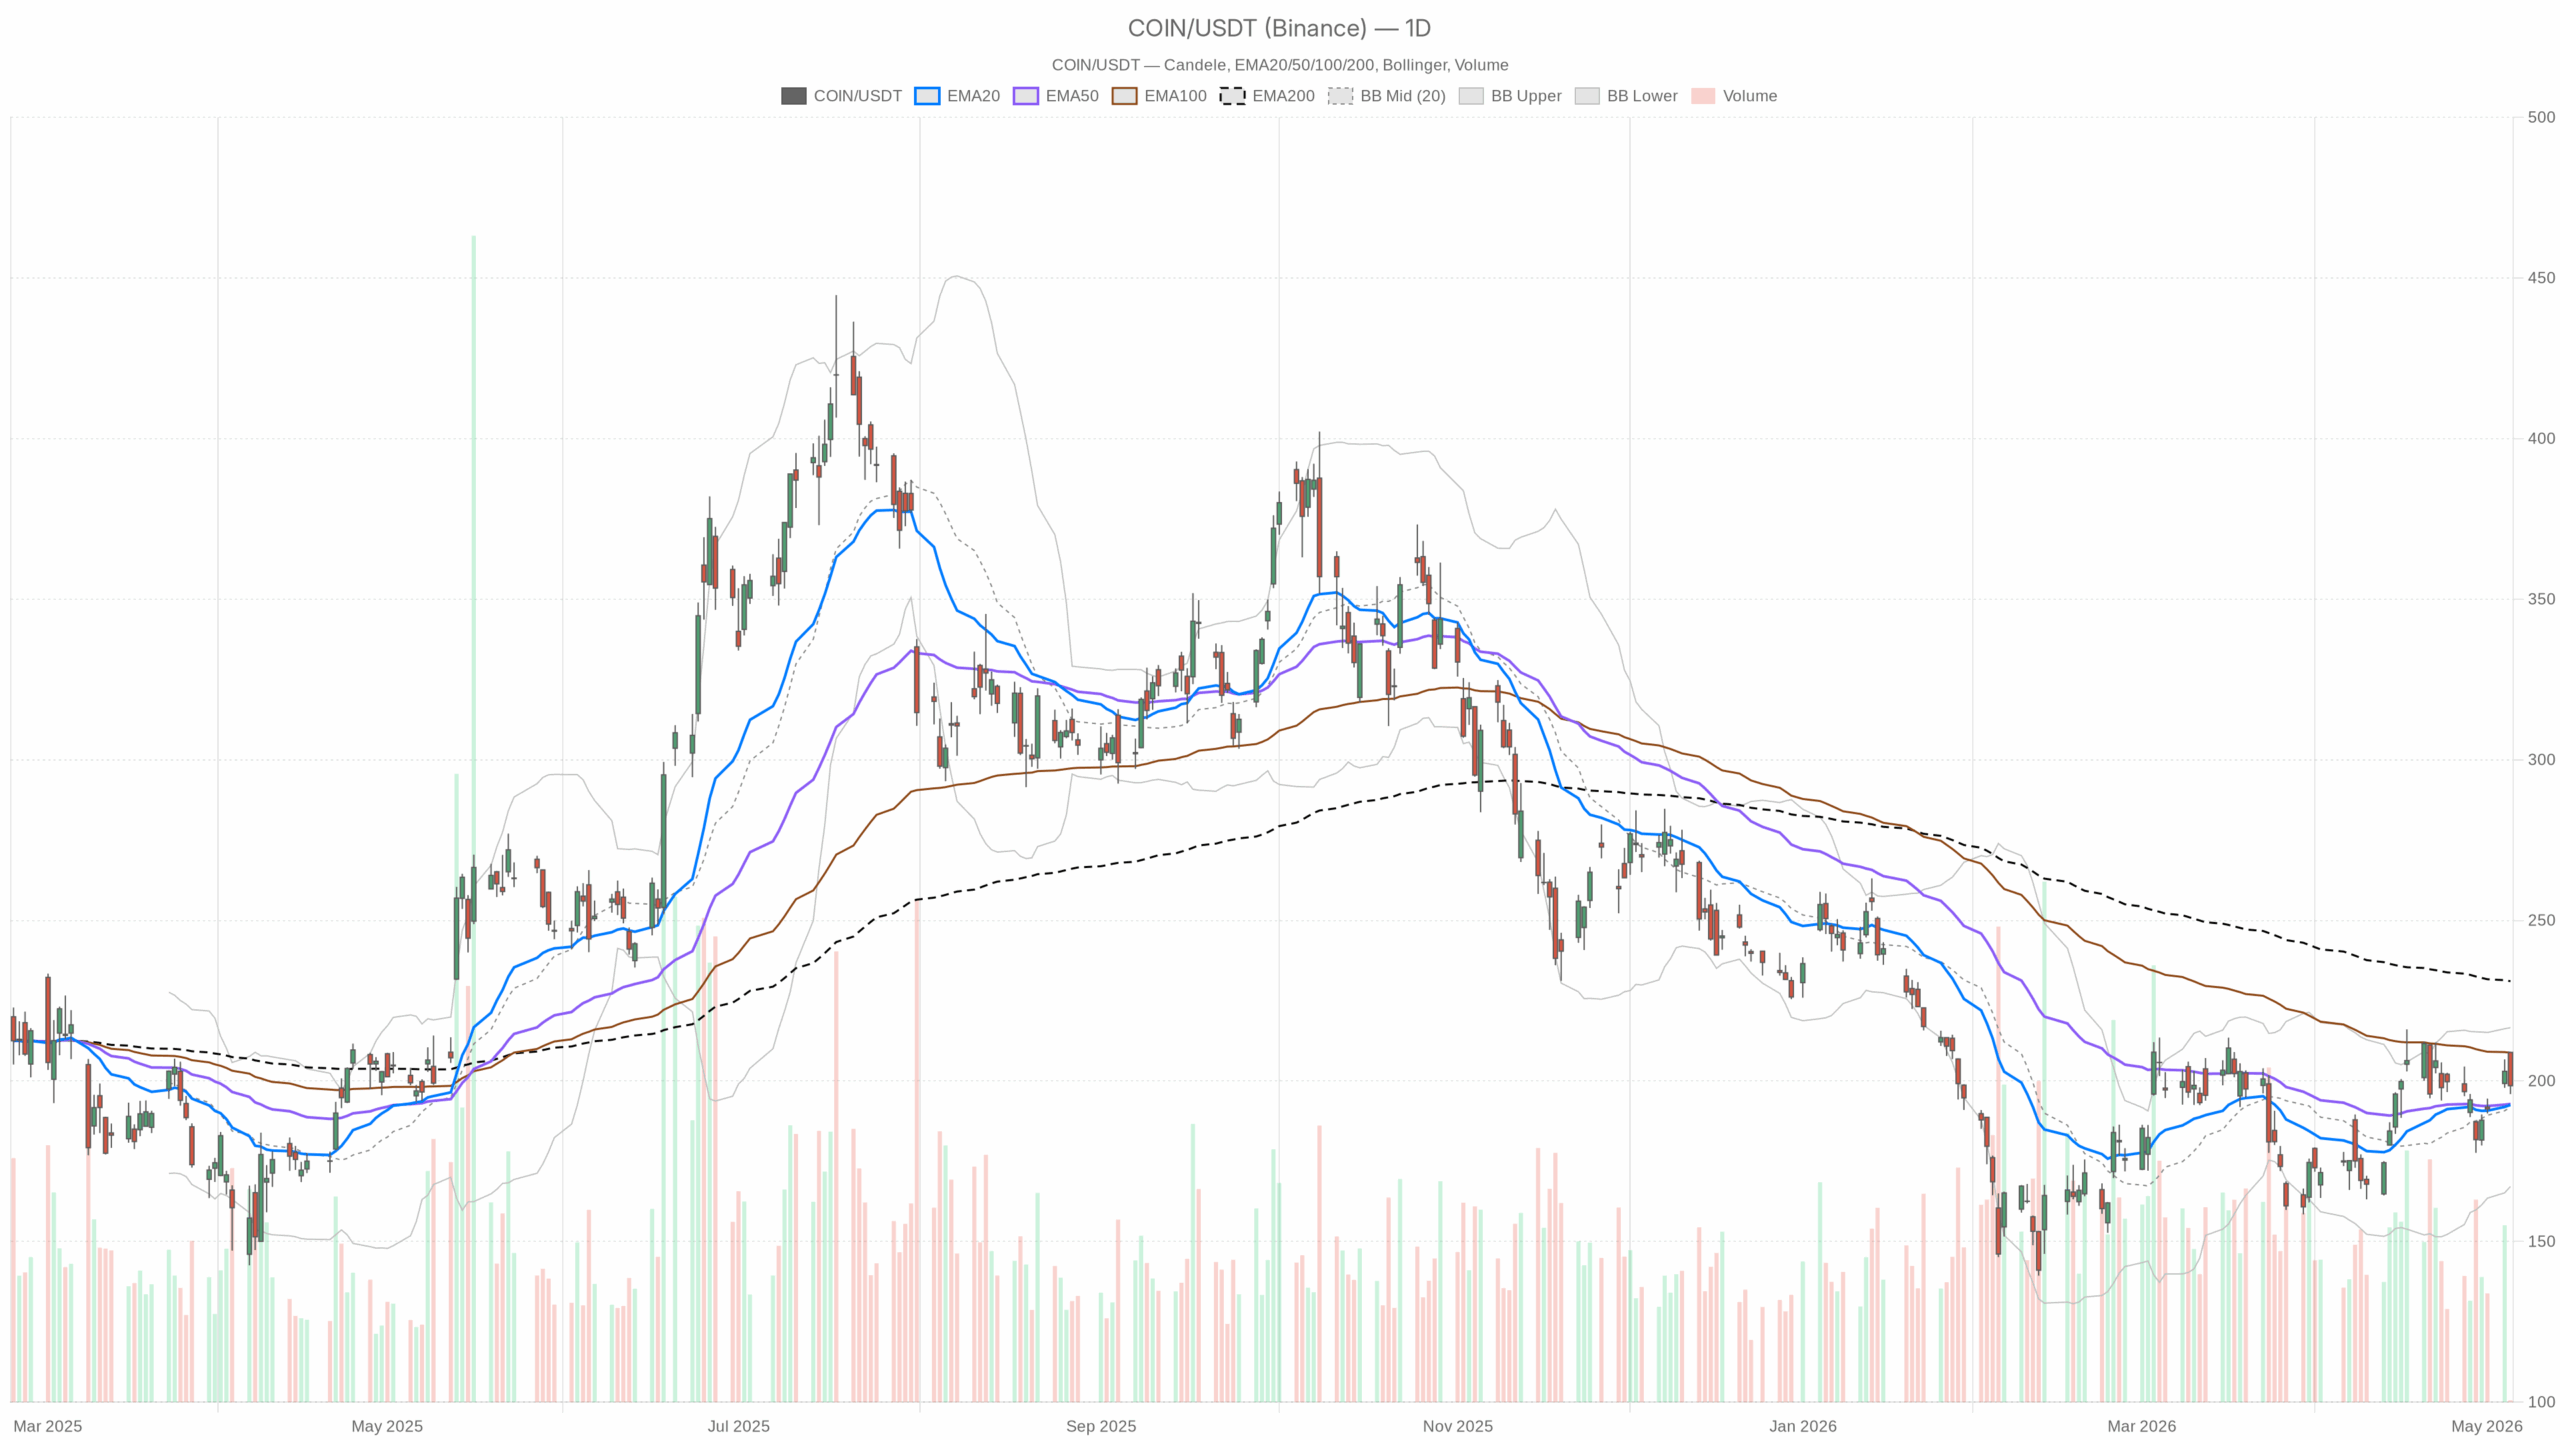
Coinbase stock daily chart remains only cautiously constructive
On the daily chart, COIN is holding above its 20-day EMA at 192.54 and 50-day EMA at 192.84. However, it remains well below the 200-day EMA at 231.04. That keeps the primary bias neutral to mildly bullish in the short term, while the longer-term trend still acts as a ceiling.
In practical terms, buyers have regained near-term control. Still, they have not fully reversed the broader damage from earlier weakness.
Momentum is improving, but not stretched
The latest daily close at 198.52 sits above the Bollinger mid-band at 191.88 and below the upper band at 216.59. Therefore, upside pressure is improving without showing an overstretched move.
Daily RSI at 54.2 is modestly above neutral. That indicates positive momentum, but not an overheated condition. Meanwhile, MACD remains positive, with the line at 2.88 above the signal at 2.69 and a small positive histogram. This supports the idea that upside momentum is present, although it is not especially strong.
Resistance is close and volatility remains meaningful
At the same time, Coinbase stock is running into an important test zone. The stock is trading just under the daily pivot at 201.10, with resistance near 206.30 and support at 193.31.
This placement reflects a market caught between improving momentum and nearby overhead supply. Meanwhile, daily ATR at 12.18 shows that COIN still carries meaningful volatility. As a result, directional conviction can be challenged quickly by wide intraday swings.
Hourly trend supports the near-term bullish case for Coinbase stock
The 1-hour chart strengthens the near-term bullish case. COIN is above the 20-hour EMA at 197.21, the 50-hour EMA at 194.96, and the 200-hour EMA at 192.10. That is a cleaner bullish alignment than on the daily chart and shows that intraday trend followers are still leaning long.
Hourly RSI at 55.89 remains in constructive territory. In addition, MACD is still positive, with a wider histogram spread than on the daily chart. In other words, short-term momentum is firmer than the broader timeframe.
However, this hourly setup does not remove the larger conflict. Price remains below the daily 200-day EMA, which is still the key marker between a recovery phase and a more durable long-term uptrend. The daily regime is neutral, while the hourly regime is bullish. That gap shows the rally is real, but it is still unfolding inside a bigger chart that has not fully turned.
15-minute Coinbase stock action points to consolidation, not reversal
On the 15-minute chart, the picture is softer and mainly useful for execution timing. COIN closed at 198.91, below the 20-period EMA at 200.78 and nearly flat to the 50-period EMA at 198.87. However, it remains above the 200-period EMA at 195.77.
Short-term RSI at 43.17 and a negative MACD histogram show fading momentum after the initial pop. That implies buyers may need to absorb a brief consolidation before attempting another push higher.
Meanwhile, the 15-minute Bollinger structure also points to cooling momentum rather than trend failure. Price is near the lower half of the band range, with the lower band at 197.11 and the intraday pivot at 198.59. Immediate resistance sits near 199.23, while support comes in around 198.27.
This suggests Coinbase stock is balancing after the news-driven surge, not necessarily reversing, unless sellers force price back through the short-term support cluster.
Coinbase stock bullish and bearish scenarios
Bullish scenario
The bullish scenario remains intact if Coinbase stock can hold above the 193 to 198 support zone and reclaim the daily pivot area above 201. A move through 206.30 would strengthen the case that buyers are extending the post-news advance.
If that happens, the next test would likely be a push toward the upper daily Bollinger band near 216.59. For bulls, the key evidence would be sustained trading above the short-term moving averages, stable RSI in positive territory, and MACD staying constructive on both the daily and hourly charts.
Bearish scenario
In contrast, the bearish scenario would develop if the current rebound fails near the 201 to 206 resistance area and price slips back below daily support at 193.31. That would weaken the recent improvement and put the 20-day and 50-day EMAs back under pressure.
A deeper loss of hourly trend structure would matter as well, especially if COIN falls below the hourly 20-, 50-, and eventually 200-period averages. In that case, today’s positive reaction to restructuring news would look more like a temporary relief move than the start of a stronger leg higher.
Overall Coinbase stock outlook
Overall, Coinbase stock has improved on the back of a favorable market reaction to its restructuring announcement, and the hourly chart confirms that buyers have near-term traction. However, the daily chart still argues for discipline rather than conviction.
The setup is constructive, but not fully resolved. With volatility still elevated and short-term momentum cooling on the 15-minute chart, positioning remains sensitive to whether COIN clears nearby resistance or slips back into its recent range.