

TSMC Stock remains in a primary bullish trend, but price is now pressing into a key resistance zone. The broader structure stays constructive. However, near-term momentum is cooling, which suggests the rally may need fresh buying pressure before extending higher.
Summary
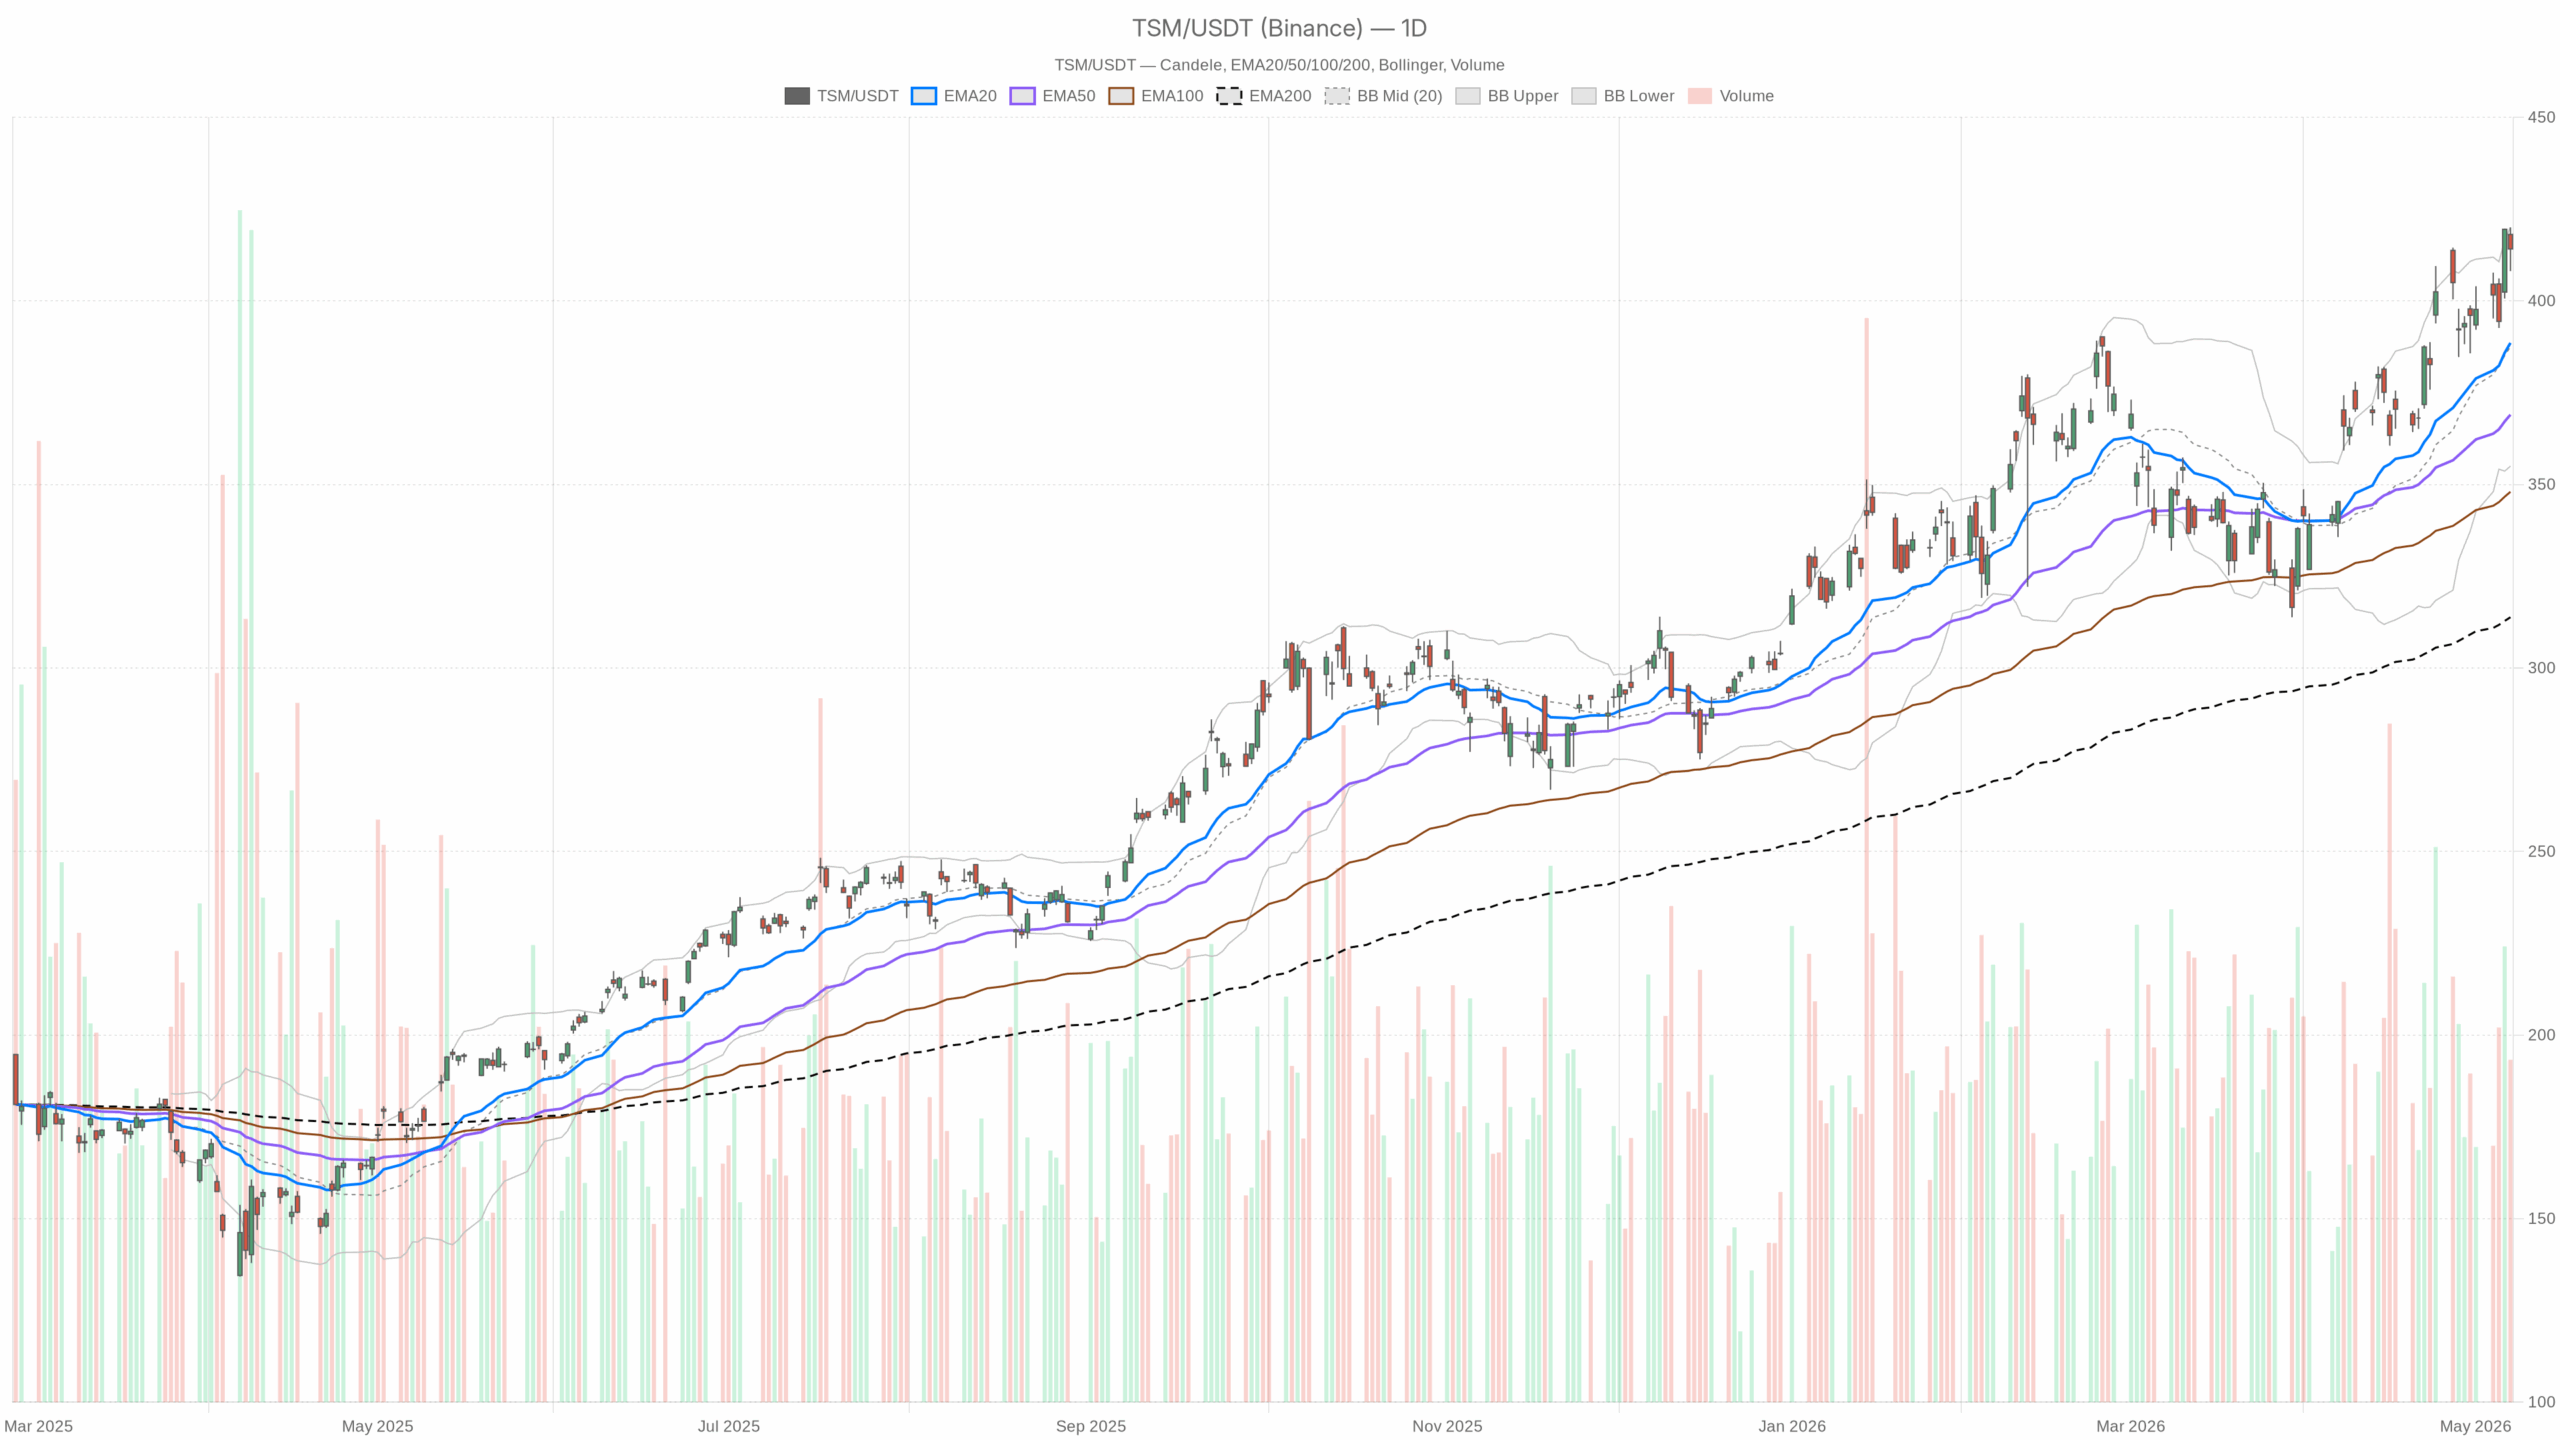
TSMC Stock Trend Remains Bullish on the Daily Chart
On the daily timeframe, TSM closed at 414.15 after trading between 408.11 and 420.00. Price is sitting almost exactly at the daily pivot point of 414.09. Resistance stands at 420.06, while support is at 408.17.
This keeps the very short-term picture balanced. However, the stock is still operating inside a broader bullish structure unless support gives way.
The moving average backdrop remains clearly supportive. Price is above the 20-day EMA at 388.56, the 50-day EMA at 369.00, and the 200-day EMA at 313.82.
That alignment reflects trend strength across short-, medium-, and long-term horizons. Therefore, buyers still control the broader path of least resistance.
Momentum Is Positive but Less Explosive
Daily RSI stands at 65.54. That is firm, but not yet extreme. It suggests momentum remains positive, although the stock is no longer in an early-stage breakout condition.
Daily MACD also supports the constructive bias. The MACD line is 14.41, above the signal line at 12.51, with a positive histogram of 1.90. This shows bullish momentum is still active on the higher timeframe. Still, the move looks more mature than newly emerging.
Volatility and Upper-Band Resistance Matter
Bollinger Bands add an important layer to the TSMC Stock setup. The middle band sits at 387.52, while the upper band is 420.06 and the lower band is 354.98. With price closing at 414.15, TSM is trading close to the upper band.
That signals strong trend participation. At the same time, it warns that upside may become less efficient if buyers cannot force a clean break through the 420 area.
Daily ATR comes in at 14.41, which is relatively elevated in absolute terms. As a result, TSM can still produce wide daily swings. Even so, sharp intraday pullbacks would not automatically change the higher-timeframe thesis.
Hourly TSMC Stock Signals Show Momentum Cooling
On the hourly chart, the picture still leans bullish, but it is less convincing than the daily trend. TSM closed at 414.25, above the 20-hour EMA at 410.02, the 50-hour EMA at 403.13, and the 200-hour EMA at 379.79.
This means the intraday trend remains upward. Meanwhile, pullbacks are still being absorbed above key dynamic support.
Short-Term Momentum Has Softened
Hourly RSI is 59.65. That suggests positive momentum is still present, but buyers are no longer pushing aggressively. At the same time, hourly MACD is slightly weaker.
The MACD line is 3.85, below the signal line at 4.30, with a negative histogram of -0.45. This indicates the bullish daily trend is losing some short-term thrust, even though it has not yet reversed.
The hourly Bollinger setup reinforces that message. The middle band is 408.98 and the upper band is 427.60, while price is at 414.25. TSM is holding above its intraday mean, which is constructive. However, it is not stretching toward the upper band with the urgency usually seen in a strong breakout phase.
Key Intraday Levels to Watch
Hourly pivot levels remain tight, with the pivot at 414.19, resistance at 416.38, and support at 412.06. This places the stock near a short-term equilibrium zone.
A push above 416.38 would improve the immediate tone. On the other hand, a slip below 412.06 would increase the odds of a deeper test lower.
15-Minute Chart Focuses on Execution
On the 15-minute chart, the signal is mostly about execution rather than trend. TSM closed at 414.25, above the 20-period EMA at 413.19, the 50-period EMA at 412.04, and the 200-period EMA at 403.10.
This gives buyers a slight tactical edge intraday. However, the move still lacks strong directional conviction.
Notably, 15-minute RSI is 53.33, which reflects neutral-to-positive momentum rather than a strong push. MACD is modestly constructive, with the line at -0.24 above the signal line at -0.45 and a positive histogram of 0.21.
That suggests short-term momentum is trying to recover after cooling off. Still, the move is not yet strong enough to resolve the bigger resistance question on its own.
The 15-minute Bollinger Bands sit between 408.23 and 417.84, with price at 414.25 and the midpoint at 413.04. This shows TSM is trading slightly above its short-term average, but remains inside a contained intraday range.
Pivot levels at 414.78, 415.79, and 413.25 matter for timing. Holding above 413.25 keeps the near-term tape stable. Meanwhile, a move through 415.79 would support another test of the hourly resistance area.
News Flow Supports the Trend but Raises Expectations
Recent coverage broadly fits the chart. Enthusiasm around TSMC’s AI-driven growth and strong share-price performance remains intact. However, a more cautious angle is emerging around foundry competition.
This leaves sentiment favorable overall. Still, expectations are elevated, and TSMC Stock may be more sensitive to any sign of slowing leadership.
TSMC Stock Bullish and Bearish Scenarios
Bullish Continuation Case
The bullish scenario remains straightforward. If TSM holds above 408.17 on the daily structure and reclaims 416.38 on the hourly chart, the market can make another run at 420.06.
A clean break above that level would show buyers are absorbing resistance rather than stalling beneath it. In that case, the broader uptrend would remain firmly intact, with momentum likely rotating higher again.
Bearish Near-Term Reset Case
In contrast, the bearish scenario starts with failure around the 416 to 420 zone and a loss of 412.06 on the hourly chart, followed by a break of 408.17 on daily support.
That would not automatically destroy the long-term uptrend, because the moving average structure remains strong. However, it would invalidate the immediate bullish continuation case. It would also suggest the stock needs a deeper reset after an extended run near the upper end of its range.
TSMC Stock Outlook
Overall, TSMC Stock still deserves a bullish higher-timeframe bias, but it is no longer in a clean chase zone. The daily chart remains strong, while the hourly chart shows momentum fatigue under resistance.
Therefore, TSM is in a constructive but more selective phase. The next move depends on whether buyers can force a decisive break above resistance, or whether volatility opens the door to a broader pullback first.