Whirlpool Stock remains in a clear bearish structure, and the latest earnings-driven selloff reinforced that view rather than changed it. Although WHR rebounded from its intraday low, the broader trend still points lower as weak fundamentals and negative technicals remain aligned.
Summary
Whirlpool Stock Trend Remains Bearish on the Daily Chart
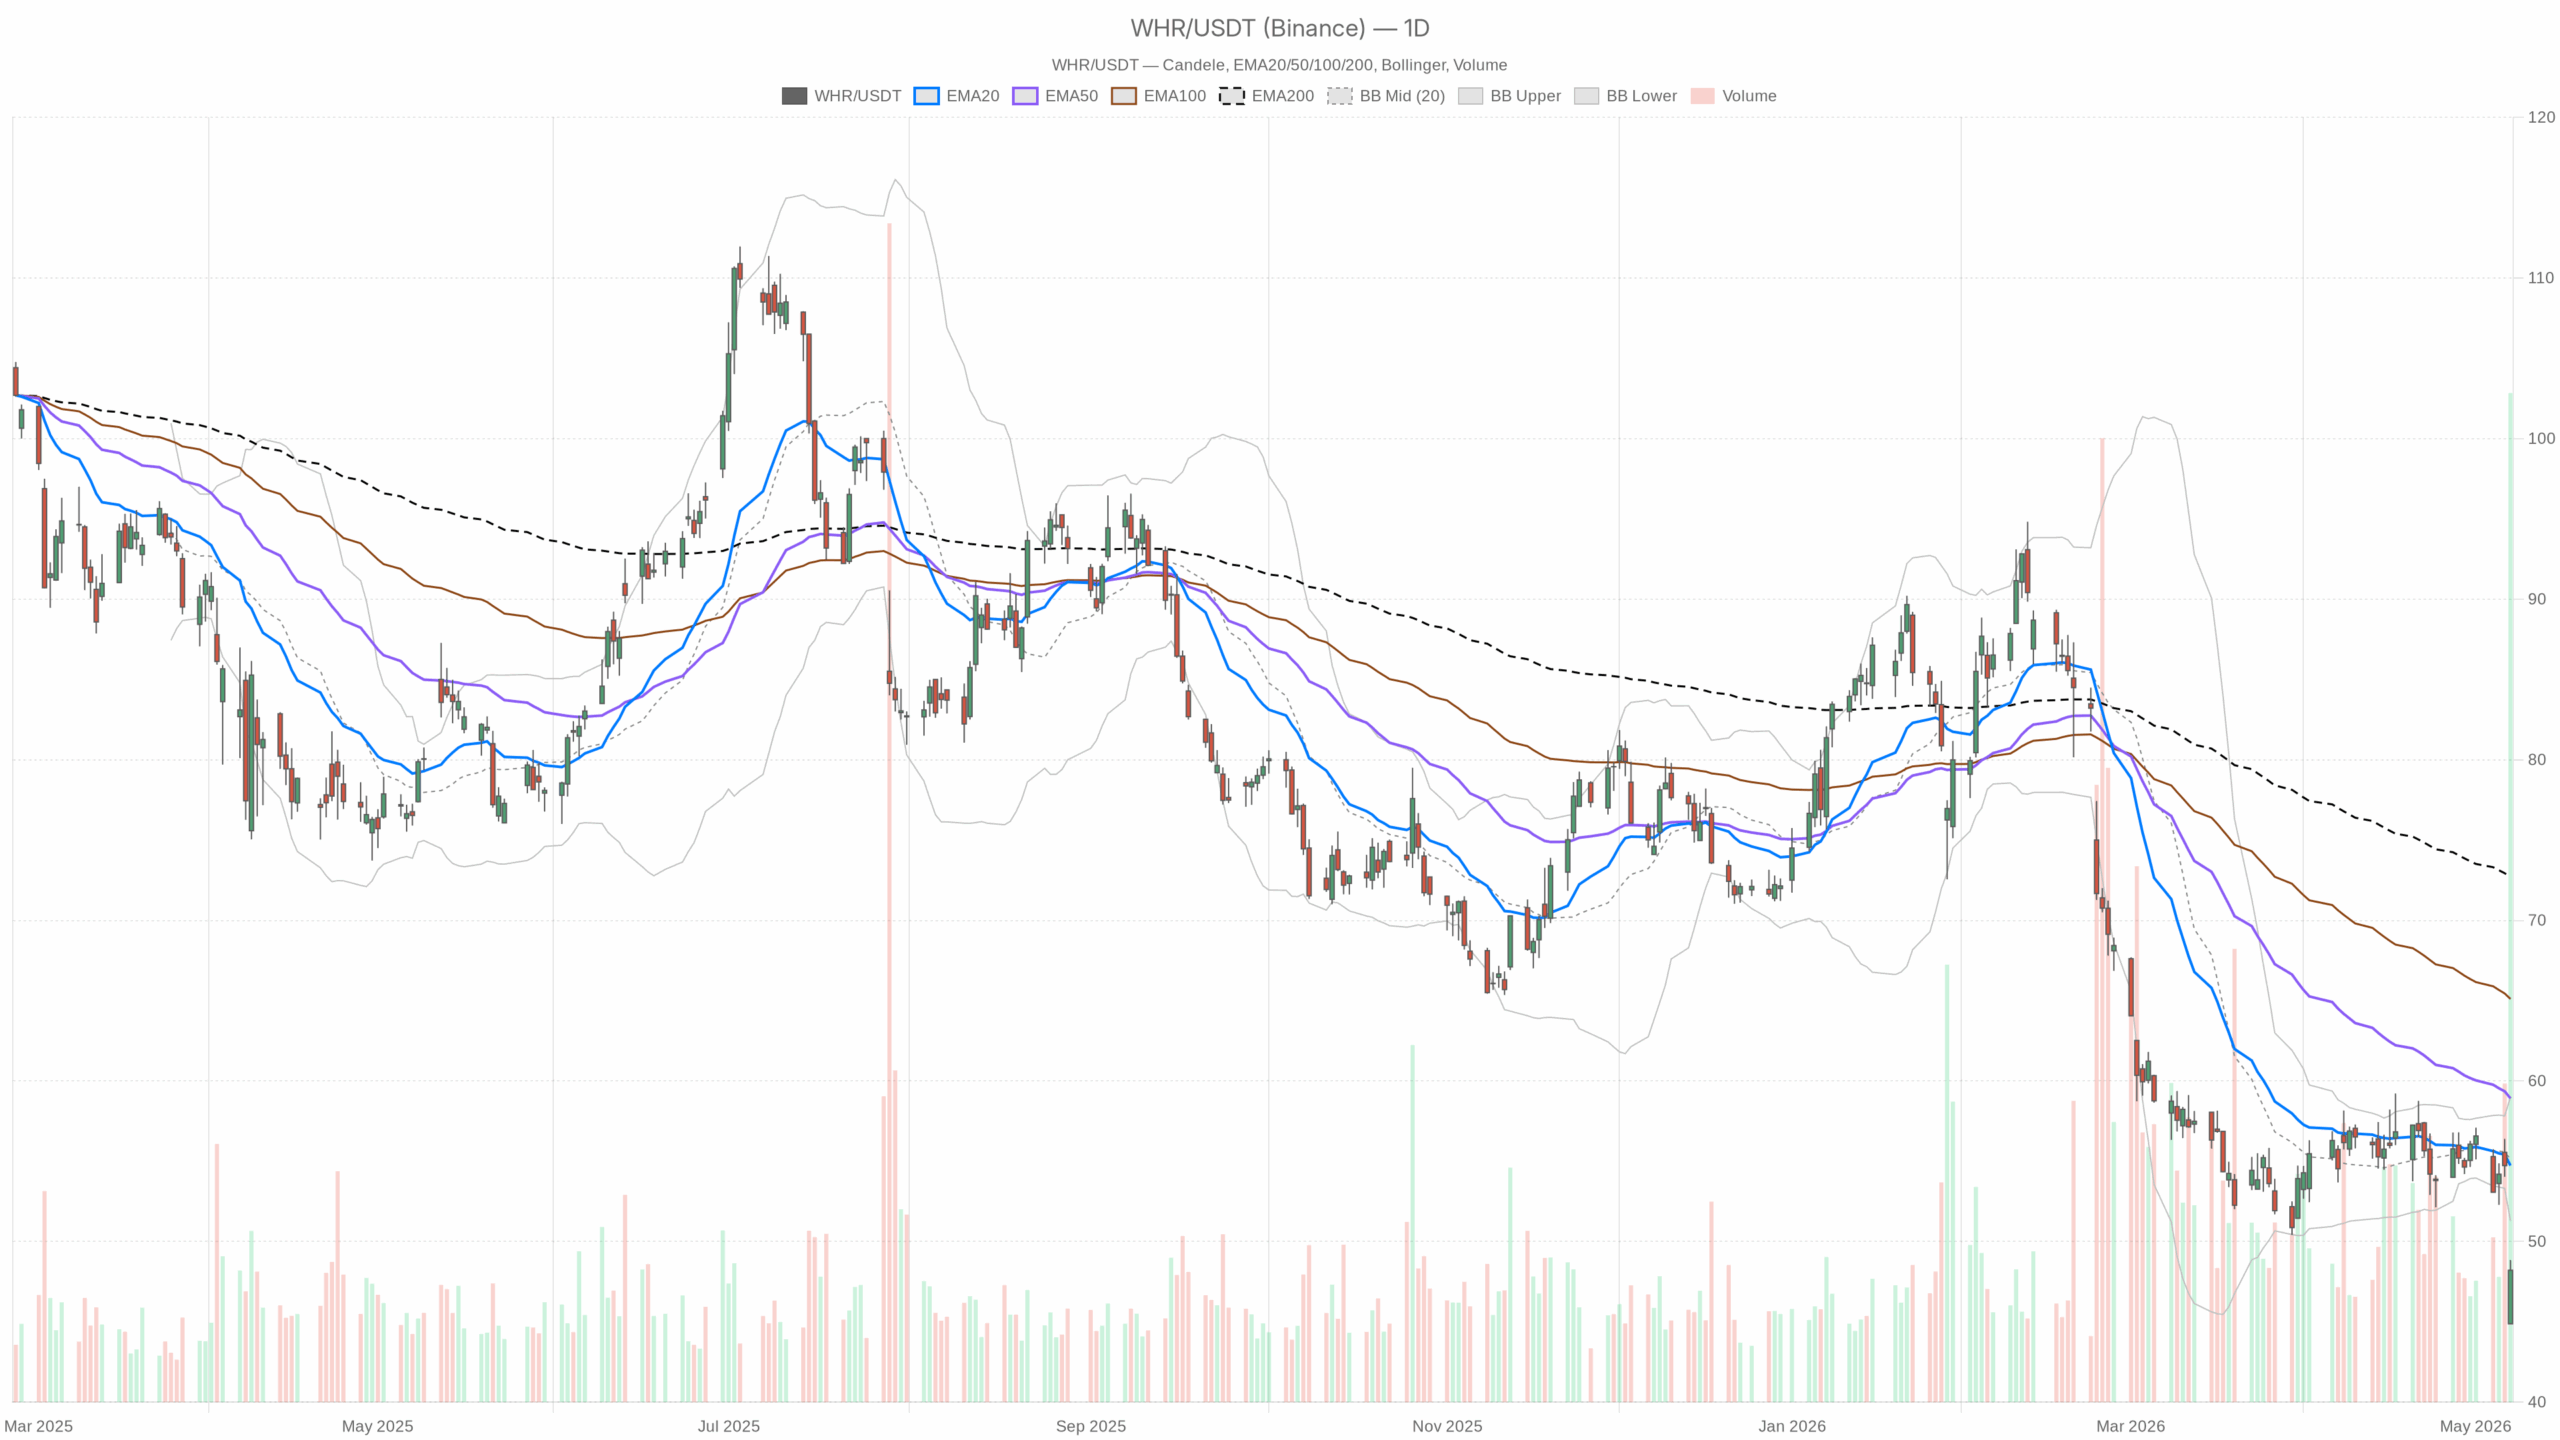
WHR closed at 48.21 after printing a fresh 52-week low at 44.87. That move showed aggressive selling pressure. The late rebound matters tactically, but it does not yet alter the broader downtrend.
On the daily timeframe, Whirlpool Stock is trading well below its 20-day EMA at 54.73, its 50-day EMA at 58.92, and its 200-day EMA at 72.69. That alignment confirms a deeply negative trend structure across short-, medium-, and long-term horizons. In practical terms, rallies are still being framed as rebounds within a larger decline, not as a confirmed base.
Momentum Still Favors the Downside
The daily RSI stands at 31.5. That is close to oversold territory and shows the stock has already absorbed heavy downside momentum. However, near-oversold readings in a strong downtrend often signal only temporary pressure exhaustion, not a lasting reversal.
Meanwhile, daily MACD remains negative, with the line at -1.41 below the signal line at -1.17 and a histogram of -0.24. Momentum is therefore still pointing lower on the primary timeframe. The message is straightforward: downside pressure has not fully cleared, even after the late-session rebound.
Volatility and Support Levels Stay Critical
Daily Bollinger Bands also underline how stretched the move has become. Whirlpool Stock closed at 48.21, below the lower band at 51.28, while the middle band sits much higher at 55.13. That signals an unusually depressed level versus its recent average, which can invite sharp snapback moves but also reflects panic-like weakness.
Volatility is no longer a side issue. Daily ATR is 2.98, which is large relative to the stock’s price and confirms that WHR is in a high-volatility regime. Therefore, directional conviction may remain bearish, but timing risk is elevated and reversals can be violent.
Pivot levels on the daily chart place the pivot point at 47.31, with resistance at 49.75 and support at 45.77. Price closed above the pivot, which slightly improves the very short-term tone after the washout. Even so, the stock remains below first resistance, so bulls have not yet regained meaningful control.
Hourly Whirlpool Stock Signals Confirm the Bearish Thesis
The hourly chart largely confirms the bearish daily view rather than challenging it. WHR closed at 48.2 on the 1-hour timeframe, still below the 20-hour EMA at 51.32, the 50-hour EMA at 53.26, and the 200-hour EMA at 54.89. That keeps the lower-high and lower-low structure intact on the tactical timeframe as well.
At the same time, the hourly RSI is 29.77, which is already in oversold territory. That shows the stock has become stretched on a shorter horizon. The implication is not that the trend has turned, but that downside may be less linear from here and more vulnerable to sharp short-covering bounces.
Hourly MACD remains weak, with the line at -1.93 below the signal line at -1.29 and the histogram at -0.64. Momentum is still negative. More importantly, it remains negative even after the rebound from the lows. That suggests buyers have stabilized price, but they have not yet shifted the underlying short-term momentum structure.
The hourly Bollinger setup adds another layer. Price is above the lower band at 45.53 but still well below the mid-band at 52.34. In other words, WHR has bounced from an extreme, yet it has not repaired enough damage to suggest a trend recovery.
Hourly ATR sits at 1.75, which remains elevated. Therefore, intraday swings are still large and headline sensitivity is likely to remain high. That fits the current backdrop, where fundamental disappointment is feeding technical instability.
15-Minute Chart Shows Stabilization, Not Reversal
On the 15-minute chart, the picture becomes more nuanced. Price at 48.2 is sitting around the 20-period EMA at 48.23, while remaining below the 50-period EMA at 50.27 and far below the 200-period EMA at 53.34. That means the very short-term tape has improved, but only within a broader bearish intraday structure.
In contrast to the higher timeframes, the 15-minute RSI is 45.09 and the MACD histogram has turned positive at 0.29. The MACD line at -0.92 is also above the signal line at -1.21. This is the clearest sign of a short-term recovery attempt. Still, because it appears only on the execution timeframe, it should be read as stabilization and timing support rather than evidence of a durable trend reversal.
The 15-minute Bollinger Bands show price near the upper band at 48.41, with the mid-band at 47.65. That reflects near-term rebound momentum after the sharp drop. However, when a stock is bouncing into nearby intraday resistance while higher timeframes remain bearish, that strength can fade quickly unless follow-through develops.
Short-term pivot levels reinforce that point. On the 15-minute chart, the pivot is 47.96 and resistance is 48.47. WHR is trading just under that resistance zone. So the immediate test for bulls is whether they can push through this area and hold above it, rather than simply rebound into it.
Fundamental Pressure Continues to Weigh on WHR
The fundamental backdrop strongly supports the technical weakness. Whirlpool reported a steep first-quarter loss, missed revenue estimates, cut its full-year forecast, and suspended its dividend. Management also described appliance demand as the weakest since the great financial crisis.
That combination is exactly the kind of catalyst that can keep rallies capped. The market is shifting from valuation support toward earnings-risk repricing. As a result, Whirlpool Stock remains vulnerable to continued pressure unless the company restores confidence in demand and earnings visibility.
Whirlpool Stock Outlook: Bullish and Bearish Scenarios
Bullish Recovery Conditions
The bullish scenario is narrow but not impossible. If Whirlpool Stock can build above the daily pivot at 47.31, clear near-term resistance from 48.47 to 49.75, and then start reclaiming ground toward the daily lower band and 20-day EMA, it would suggest forced selling is fading. For that case to gain credibility, the hourly momentum profile would also need to improve, not just the 15-minute chart.
Bearish Scenario Remains the Base Case
On the other hand, the bearish scenario remains the base case. A failure to hold above the 47.31 pivot, followed by renewed pressure through 45.77 support and back toward the 44.87 low, would confirm that the rebound was only a reflex move after oversold conditions. In that event, the daily trend would remain firmly in control and the market would likely continue pricing in weaker demand and lower earnings visibility.
Overall, Whirlpool Stock is still trading as a damaged asset in a confirmed downtrend. The daily and hourly charts remain aligned on the bearish side, while the 15-minute chart shows only a modest recovery attempt. Therefore, WHR remains vulnerable to further volatility, with tactical rebound potential present but not yet strong enough to overturn the broader bearish thesis.