

Akamai Stock remains in a firm daily uptrend, while intraday momentum cools around the pivotal 151–153 band. AI infrastructure re-rating, a major contract win, and analyst support keep the medium-term bias higher, yet the tape shows consolidation that shifts execution to well-defined pivots.
Summary
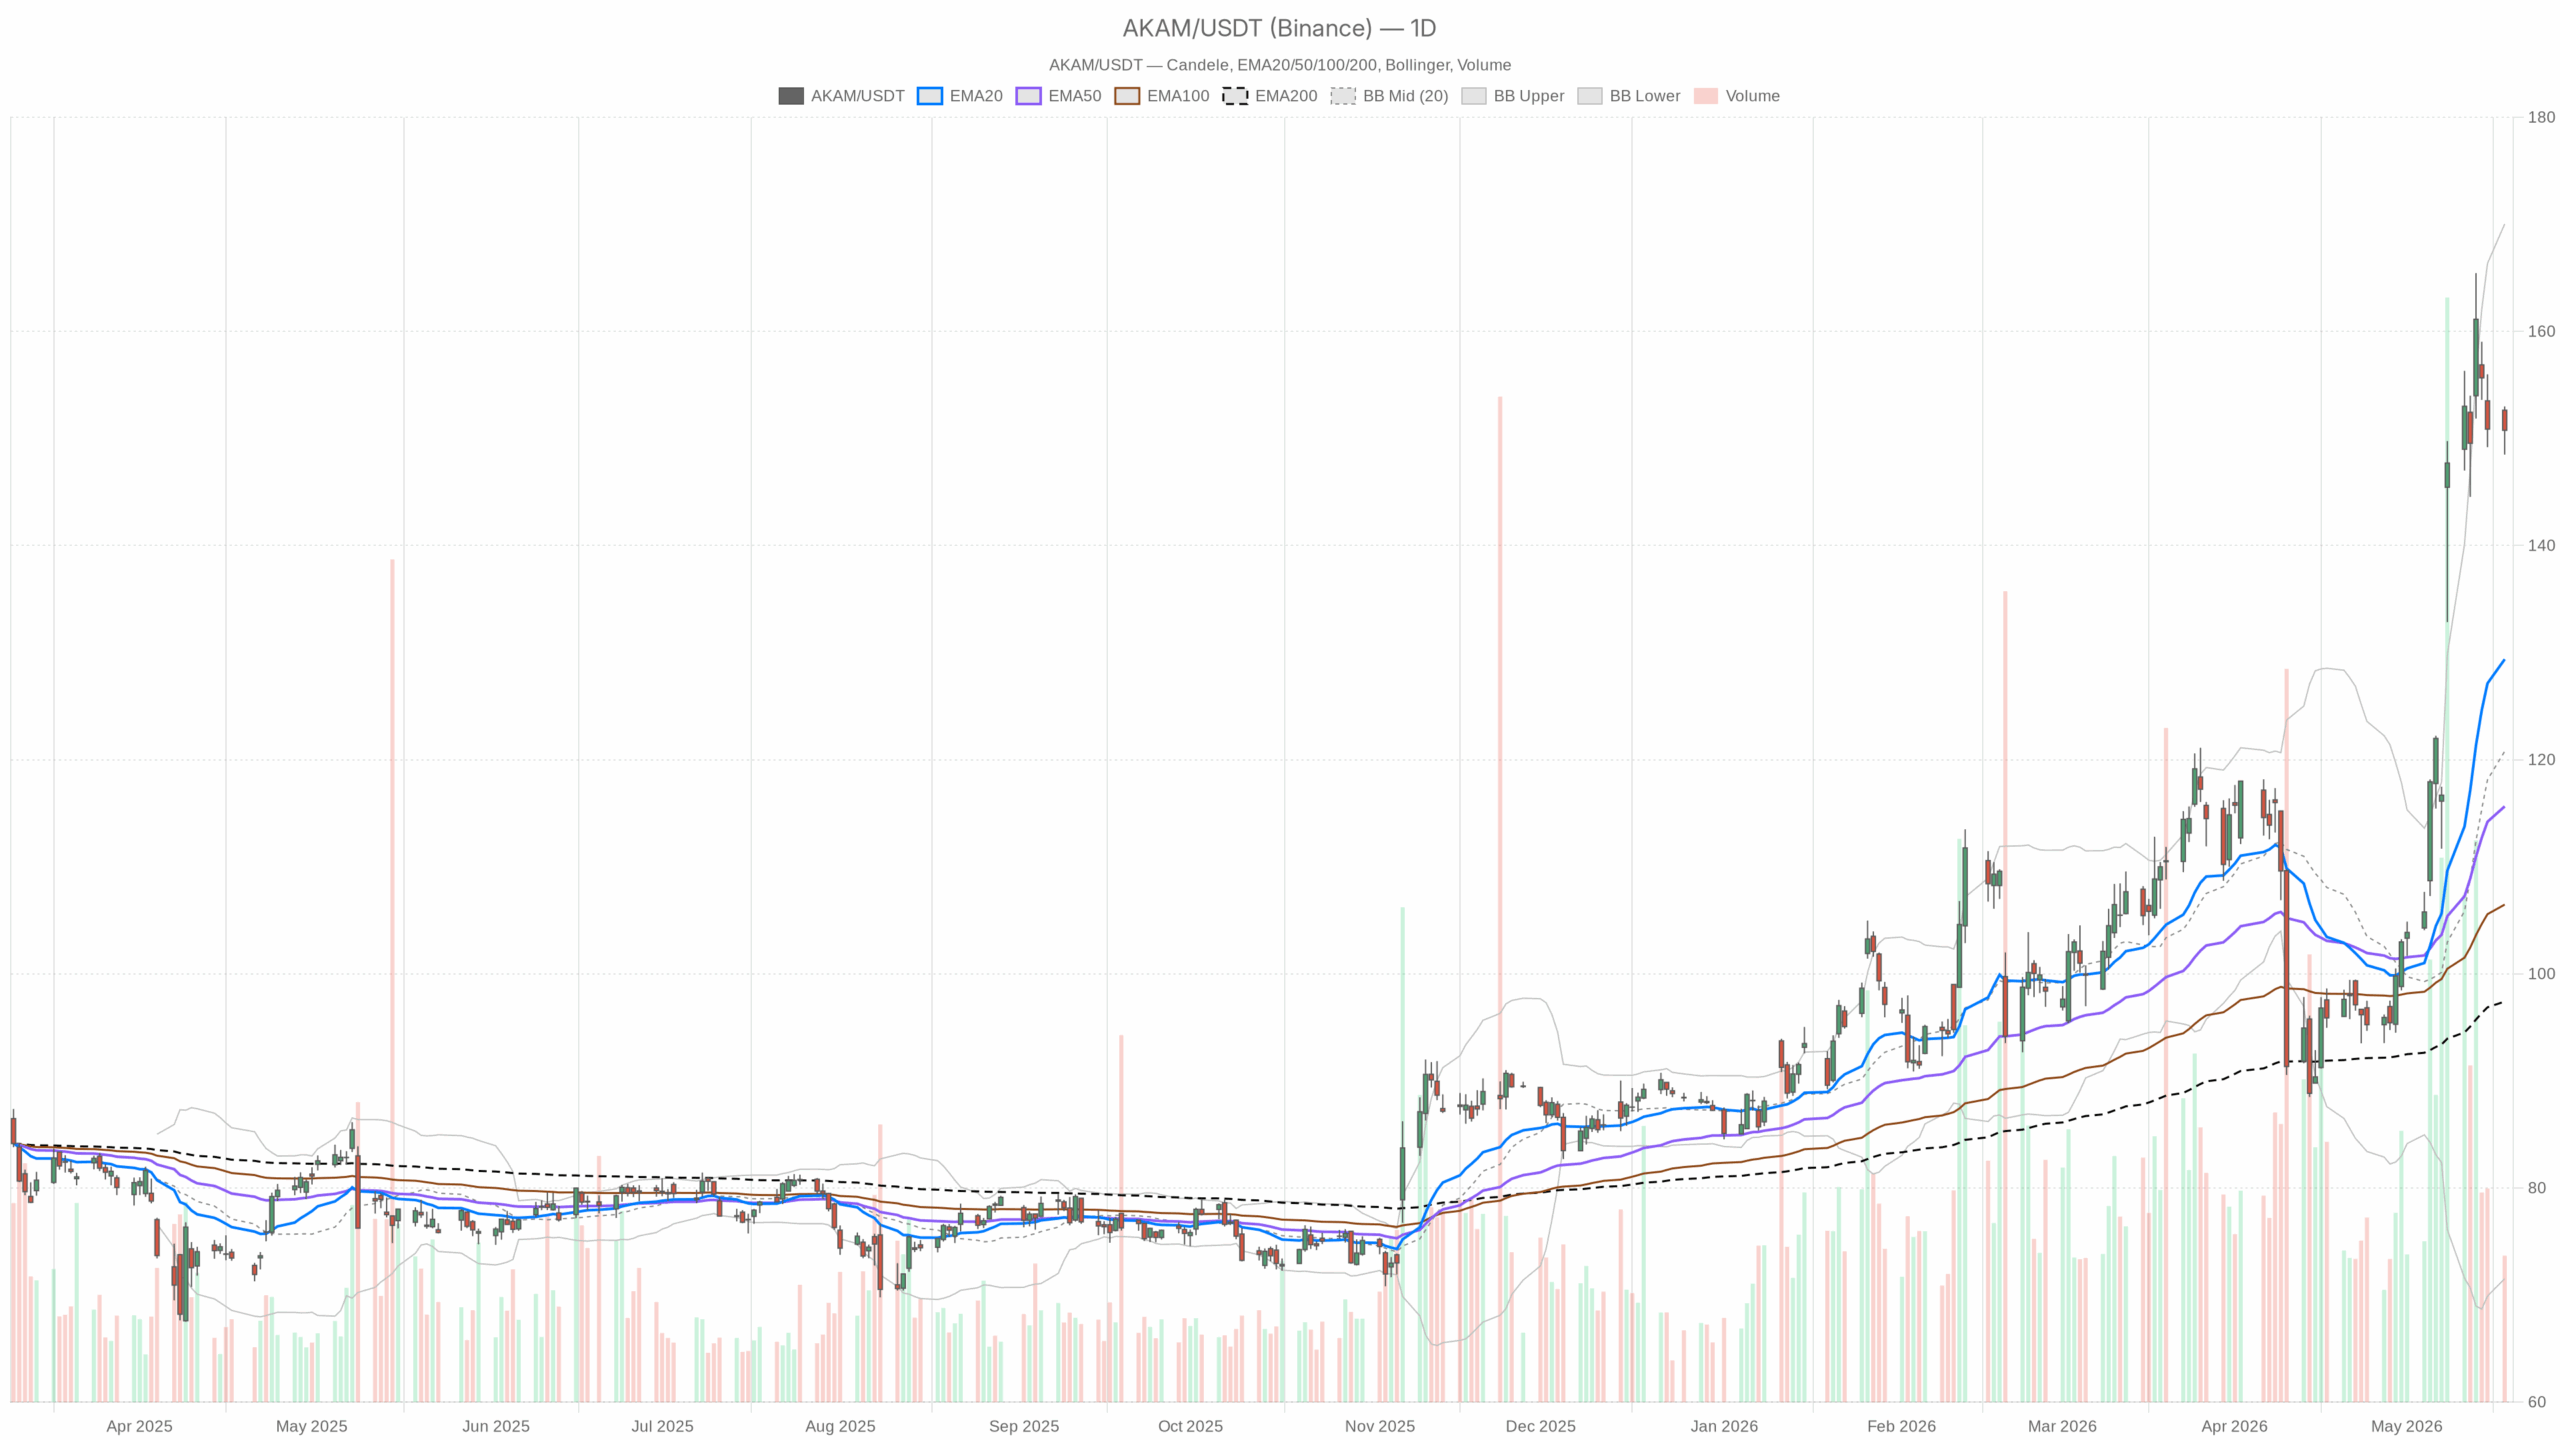
Akamai Stock: Daily Bull Trend Intact
On the daily timeframe, AKAM closed at 150.77, above key moving averages. EMA20 129.38, EMA50 115.64, and EMA200 97.41 are all rising and well below price. That alignment confirms an established uptrend. RSI14 69.43 signals strong momentum, yet it is near overbought where upside can slow.
Meanwhile, MACD shows a line at 13.84 versus a 9.55 signal with a 4.30 histogram—an expanding positive spread consistent with trend continuation. Bollinger Bands center at 120.79 with an upper at 170.04 and lower at 71.53; price rides the upper half, typical of a powerful advance. ATR14 9.56 implies larger swings. The daily pivot sits at 150.76 with R1 153.01 and S1 148.51; price parked near the pivot, signaling balance before the next move.
AKAM Hourly Chart: Momentum Pauses Near Pivot
On the 1H chart, the regime is neutral, tempering daily strength. EMA20 151.27 sits just above spot; trading below the hourly mean hints at a pause. EMA50 146.12 remains well beneath price, so the intermediate intraday trend is still up, though stretched. RSI14 prints 49.78, a neutral tone with no directional edge. In addition, MACD shows a -0.14 line versus a 0.52 signal and a -0.65 histogram, consistent with consolidation. Bollinger mid stands at 152.09; trading below the mid confirms mean‑reversion pressure. ATR14 2.11 keeps ranges moderate. The hourly pivot is 150.32 with R1 151.42 and S1 149.68; price sits slightly above the pivot, reflecting a modest bid without breakout.
15-Minute Setup: Neutral-to-Firm
At the same time, the 15m execution context is neutral‑to‑firm. EMA20 150.09 is below price while EMA50 150.99 is above; price wedged between near‑term averages signals a coil. RSI14 at 54.49 is mildly constructive; buyers hold a slight edge. Moreover, MACD shows a -0.29 line versus a -0.38 signal with a 0.09 histogram; a small uptick points to a tentative turn higher. Bollinger mid is 150.07 with an upper at 151.11; price near the upper band shows short‑term buying pressure. ATR14 0.71 keeps micro ranges tight. The 15m pivot at 150.50 with R1 151.24 and S1 150.02 frames immediate levels; price above the pivot keeps near‑term momentum intact.
Key Decision Zone: 151–153 for Akamai Stock
Therefore, timeframes conflict modestly: daily strength meets hourly neutrality, while the 15m leans higher. That mix argues for a buy‑the‑dip tape within an uptrend, but with greater sensitivity to intraday levels. Practically, the 151–153 zone carries extra weight today for Akamai Stock.
News Flow Supports AI Infrastructure Re-Rating
Notably, recent headlines back the structural shift. A seven‑year, $1.8 billion AI infrastructure contract and the planned LayerX acquisition reinforced the cloud and security narrative. In addition, Bank of America’s upgrade and higher price target underscored a perception shift away from “legacy” toward AI‑enabled infrastructure. This news flow aligns with the bullish daily regime and helps explain the sharp re‑rating in AKAM stock price.
Bullish Scenario: Triggers and Confirmation
For the bullish scenario, watch for a sustained push above the hourly R1 151.42 and the 15m R1 151.24, followed by a daily pivot‑to‑R1 transition toward 153.01. Reclaiming and holding the 1H EMA20 151.27 would confirm momentum repair. Furthermore, an RSI on 1H lifting above 50 and a MACD flattening then crossing up would endorse continuation. With daily ATR 9.56, a multi‑dollar range extension is plausible once resistance gives way.
Bearish Scenario: Levels That Invalidate Near-Term Strength
On the other hand, the bearish path emerges if price fails at 151–153 and slips below layered supports. A drop through the 1H S1 149.68 and the daily S1 148.51 would warn of a deeper pullback. The next tactical downside reference sits near the 1H EMA50 146.12. A narrowing MACD histogram and an RSI rolling under 60 on the daily would further invalidate the near‑term bullish case. Only a break toward the daily EMA20 129.38 would challenge the broader bull trend; that risk marker is distant.
Outlook: Bias Up, Respect Pivots and ATR
Overall, the main bias stays bullish on the daily chart, while the 1H says prove it and the 15m offers timing around pivots. Volatility remains elevated by ATR, so whipsaws near 150–151 are likely before direction resolves. Until the 1H re‑accelerates, respect the pivots and the 151–153 band as the decision zone for Akamai Stock.