

Intel Stock is holding its bullish daily trend despite noisy headlines and a sharp intraday shakeout. The structure favors higher over time, yet the next leg likely hinges on whether buyers can reclaim and hold the 111–112 zone.
Summary
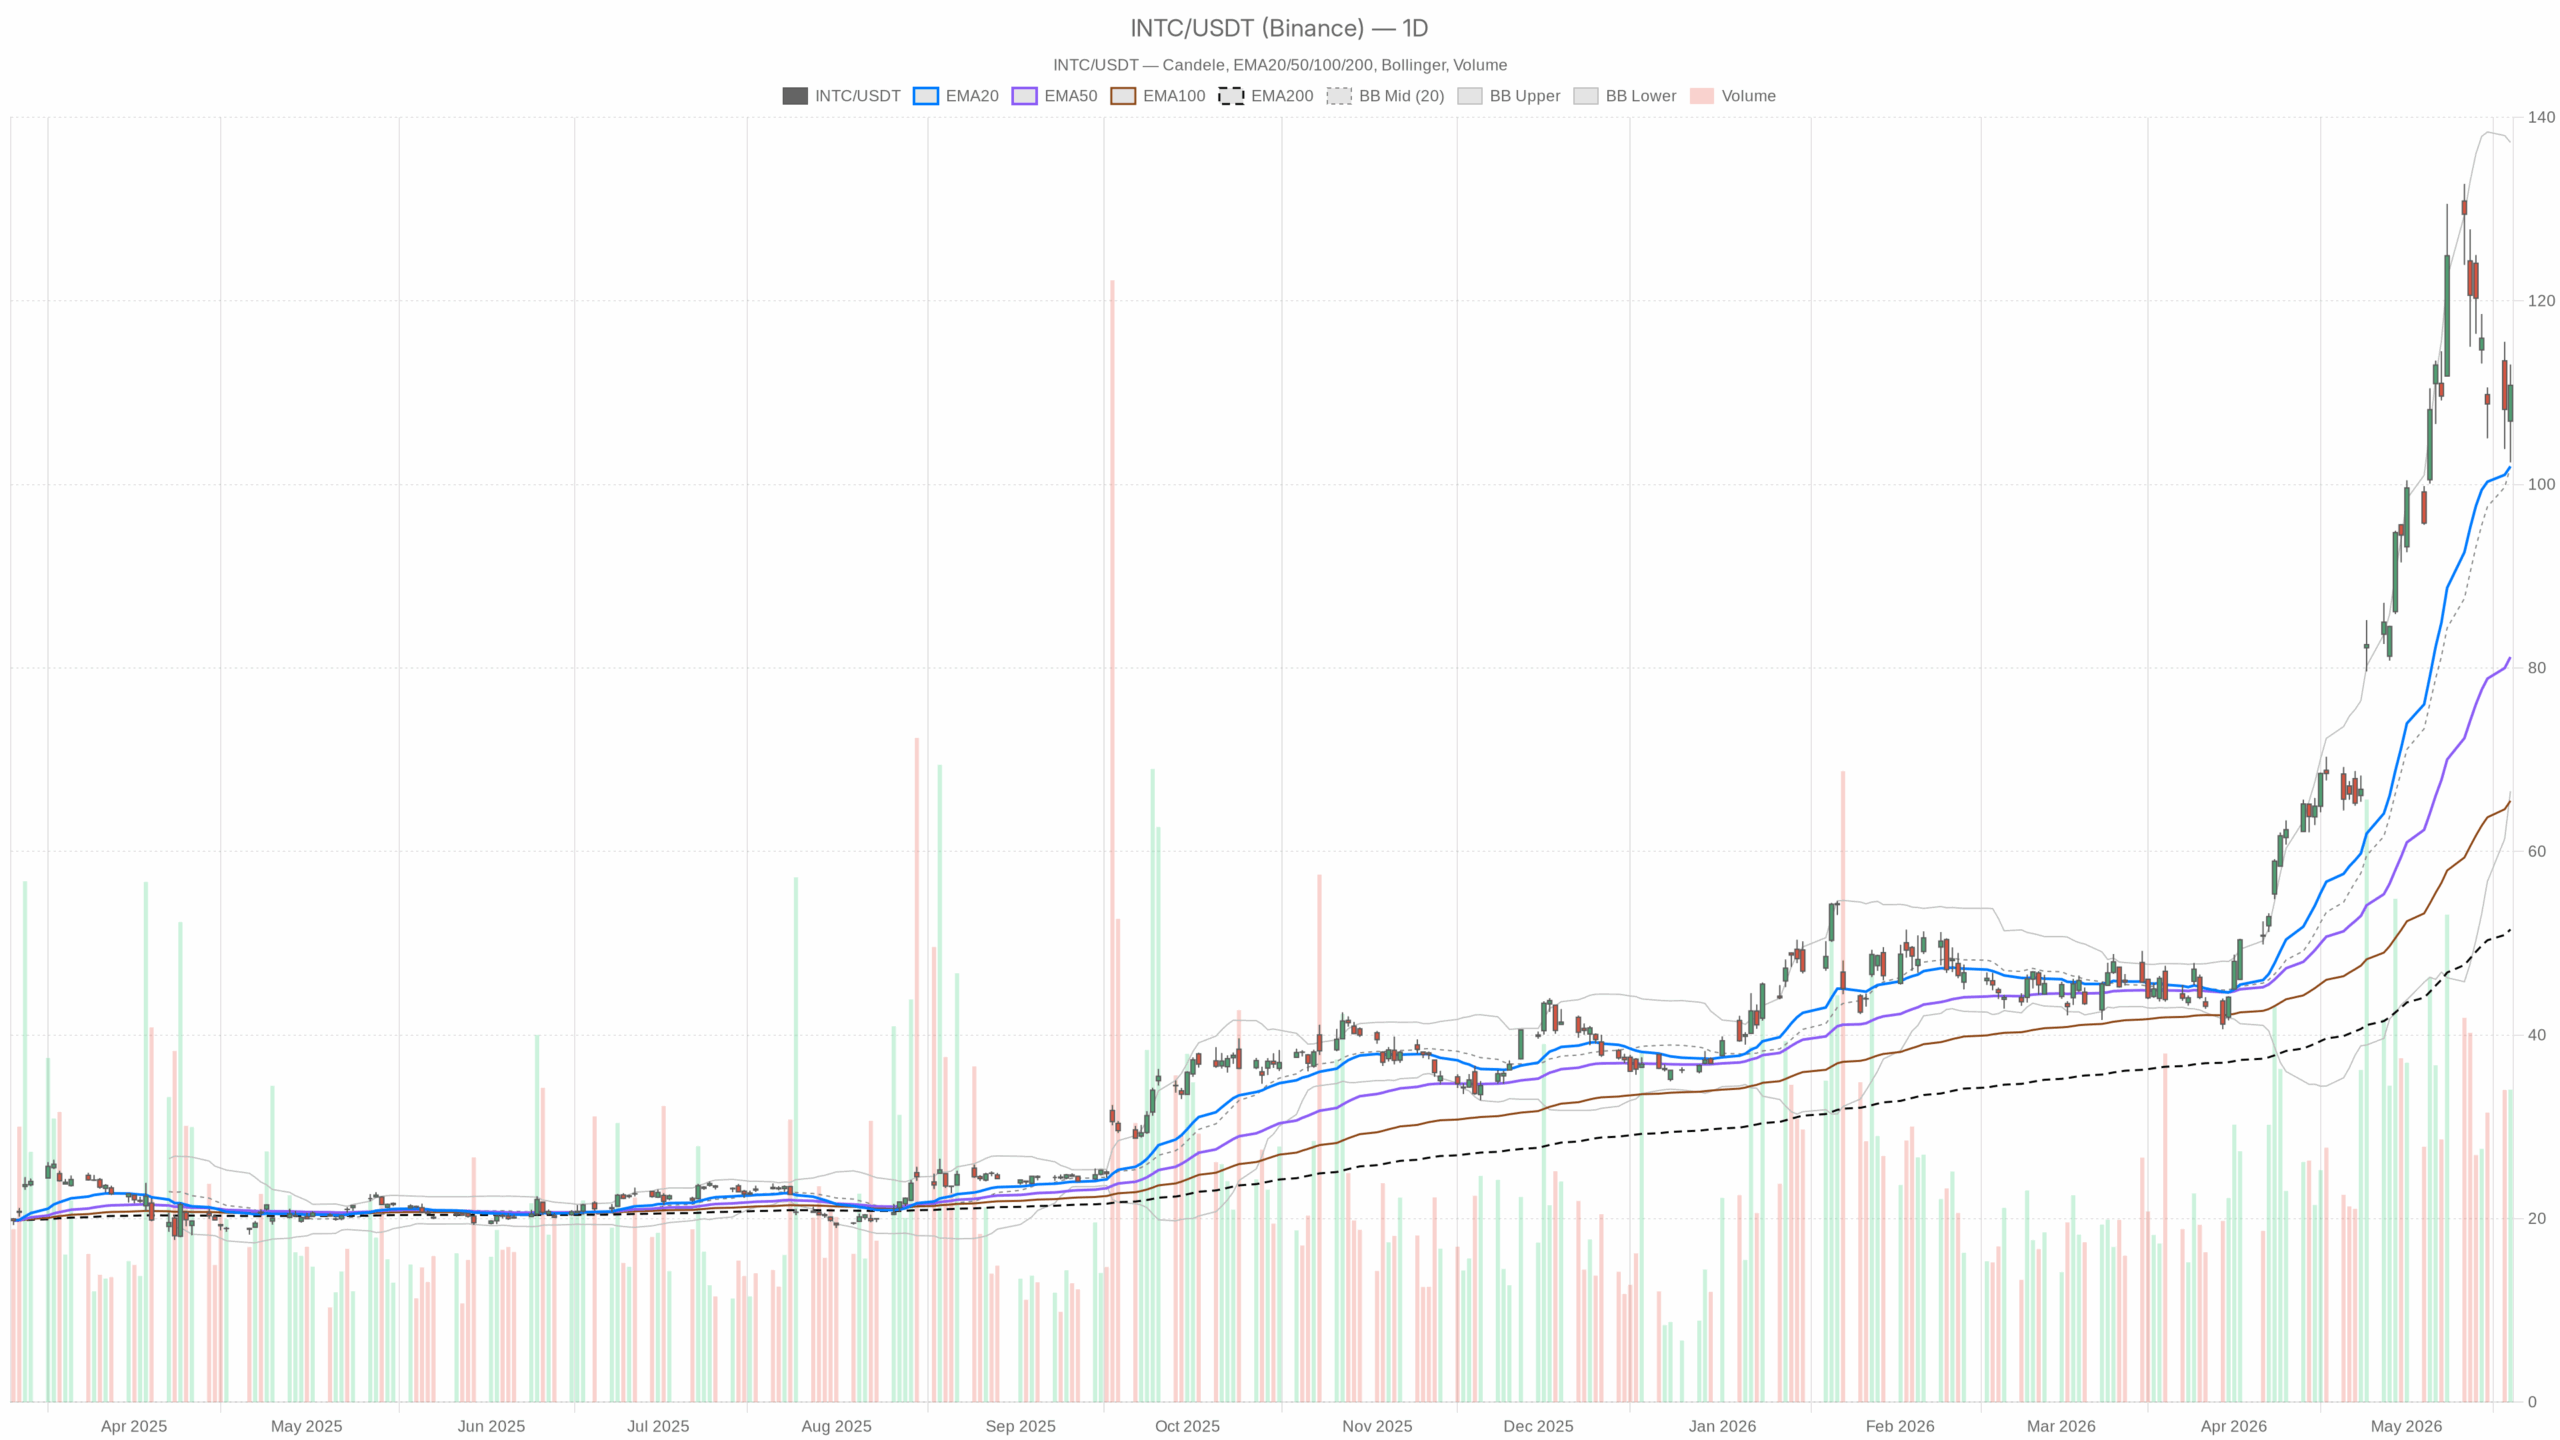
Intel Stock Daily Technical Outlook
Trend and Moving Averages
On the Daily chart, INTC closed at 110.80, well above the 20-, 50-, and 200-day EMAs at 101.97, 81.20, and 51.50. Interpretation: price remains firmly in an uptrend with layered moving-average support beneath.
Momentum and Volatility
The RSI(14) sits at 63.31. Interpretation: buyers have control without signs of daily overextension. However, the MACD line (12.89) is below its signal (14.31) and the histogram is negative (-1.42). Interpretation: momentum has cooled, so upside may require consolidation or a fresh catalyst.
Meanwhile, Bollinger Bands are wide with a mid at 101.92, an upper at 137.27, and a lower at 66.57. Interpretation: volatility is elevated and swings can stretch further than usual. Additionally, ATR(14) is 9.74. Interpretation: the typical daily range remains large, so risk and reward move together.
Daily Pivots
Daily pivot levels show PP at 108.76, R1 at 115.11, and S1 at 104.44. Interpretation: 108.76 is first support on dips, while 115.11 is the next meaningful upside trigger.
Intel Stock News and Sentiment
News flow is mixed. A Yahoo Finance piece flagged market share pressure in server CPUs and noted an analyst target cut, which coincided with an intraday drop. In contrast, multiple Motley Fool articles highlighted progress in manufacturing and the longer AI cycle. Interpretation: sentiment is choppy, but the daily uptrend has, so far, absorbed the noise.
1H Intraday Outlook
On the 1H timeframe, the regime reads neutral. Price at 110.77 sits between the 20-EMA (109.82) and the 50-EMA (111.31). Interpretation: intraday tone is balanced, with nearby resistance overhead.
The RSI(14) is 50.62. Interpretation: momentum is flat intraday. However, the MACD line (-1.05) is above its signal (-2.00) with a positive histogram (0.95). Interpretation: an early turn higher is attempting to form.
Meanwhile, Bollinger Bands center on 108.15, with the upper at 112.69 and the lower at 103.61. Interpretation: price is approaching the upper band, where fade risk often increases short term. Additionally, ATR(14) is 3.44. Interpretation: hourly ranges are sizeable, supporting two-way trade.
Hourly pivots show PP at 110.98, R1 at 112.10, and S1 at 109.66. Interpretation: 110.98 is the immediate balance line; 112.10 is the first resistance to clear for momentum to expand.
15-Minute Setup
On the 15-minute chart, the regime is neutral as well. The 20-EMA (110.23) is above the 50-EMA (109.31), yet price sits below the 200-EMA (111.66). Interpretation: short-term bids are active, but rallies face a cap near 111.66.
The RSI(14) prints 56.09. Interpretation: mild bullish bias intraday. The MACD line (1.16) is slightly below its signal (1.19) with a near-flat histogram (-0.03). Interpretation: momentum is pausing after the bounce.
Meanwhile, the Bollinger mid is 110.04 with an upper at 114.56 and a lower at 105.53. Interpretation: price is near the middle of its short-term range. The 15-minute pivot is 110.57, with R1 at 111.26 and S1 at 110.07. Interpretation: 110.07–110.57 is tactical support, while 111.26 and the 200-EMA at 111.66 are immediate hurdles.
Bias and Key Levels
Overall, the Daily uptrend defines the main bias as bullish, yet with momentum fatigue. At the same time, the 1H shows a tentative inflection higher but still below nearby resistance. Therefore, the path of least resistance improves above 111–112 and complicates below 110 for Intel Stock.
Scenarios: Bullish and Bearish
- Bullish scenario: a push and hold above 111.31 (1H 50-EMA) and 112.10 (1H R1) would open a run toward 115.11 (Daily R1). Interpretation: that sequence would align intraday momentum with the prevailing daily trend. Notably, a stabilizing Daily MACD and an RSI that stays near the 60s would reinforce a continuation setup.
- Bearish scenario: failure at 111–112 and a slip back below 110.98 (1H PP) and 110.57 (15m PP) would refocus price on 109.66 (1H S1) and 108.76 (Daily PP). Interpretation: losing those levels would weaken the bullish case. In contrast, a Daily close under 108.76 would mark a meaningful momentum setback, with 104.44 (Daily S1) next. Ultimately, a drop through the 20-day EMA at 101.97 would shift the broader trend from “buy the dip” to “prove it.”
In closing, Intel’s uptrend remains intact, but volatility is high and headlines are conflicting. Consequently, expect wider swings around the 110.98 pivot and the 111–112 shelf. Until momentum re-accelerates, traders face a range-bound tape with a bullish lean for Intel Stock.