

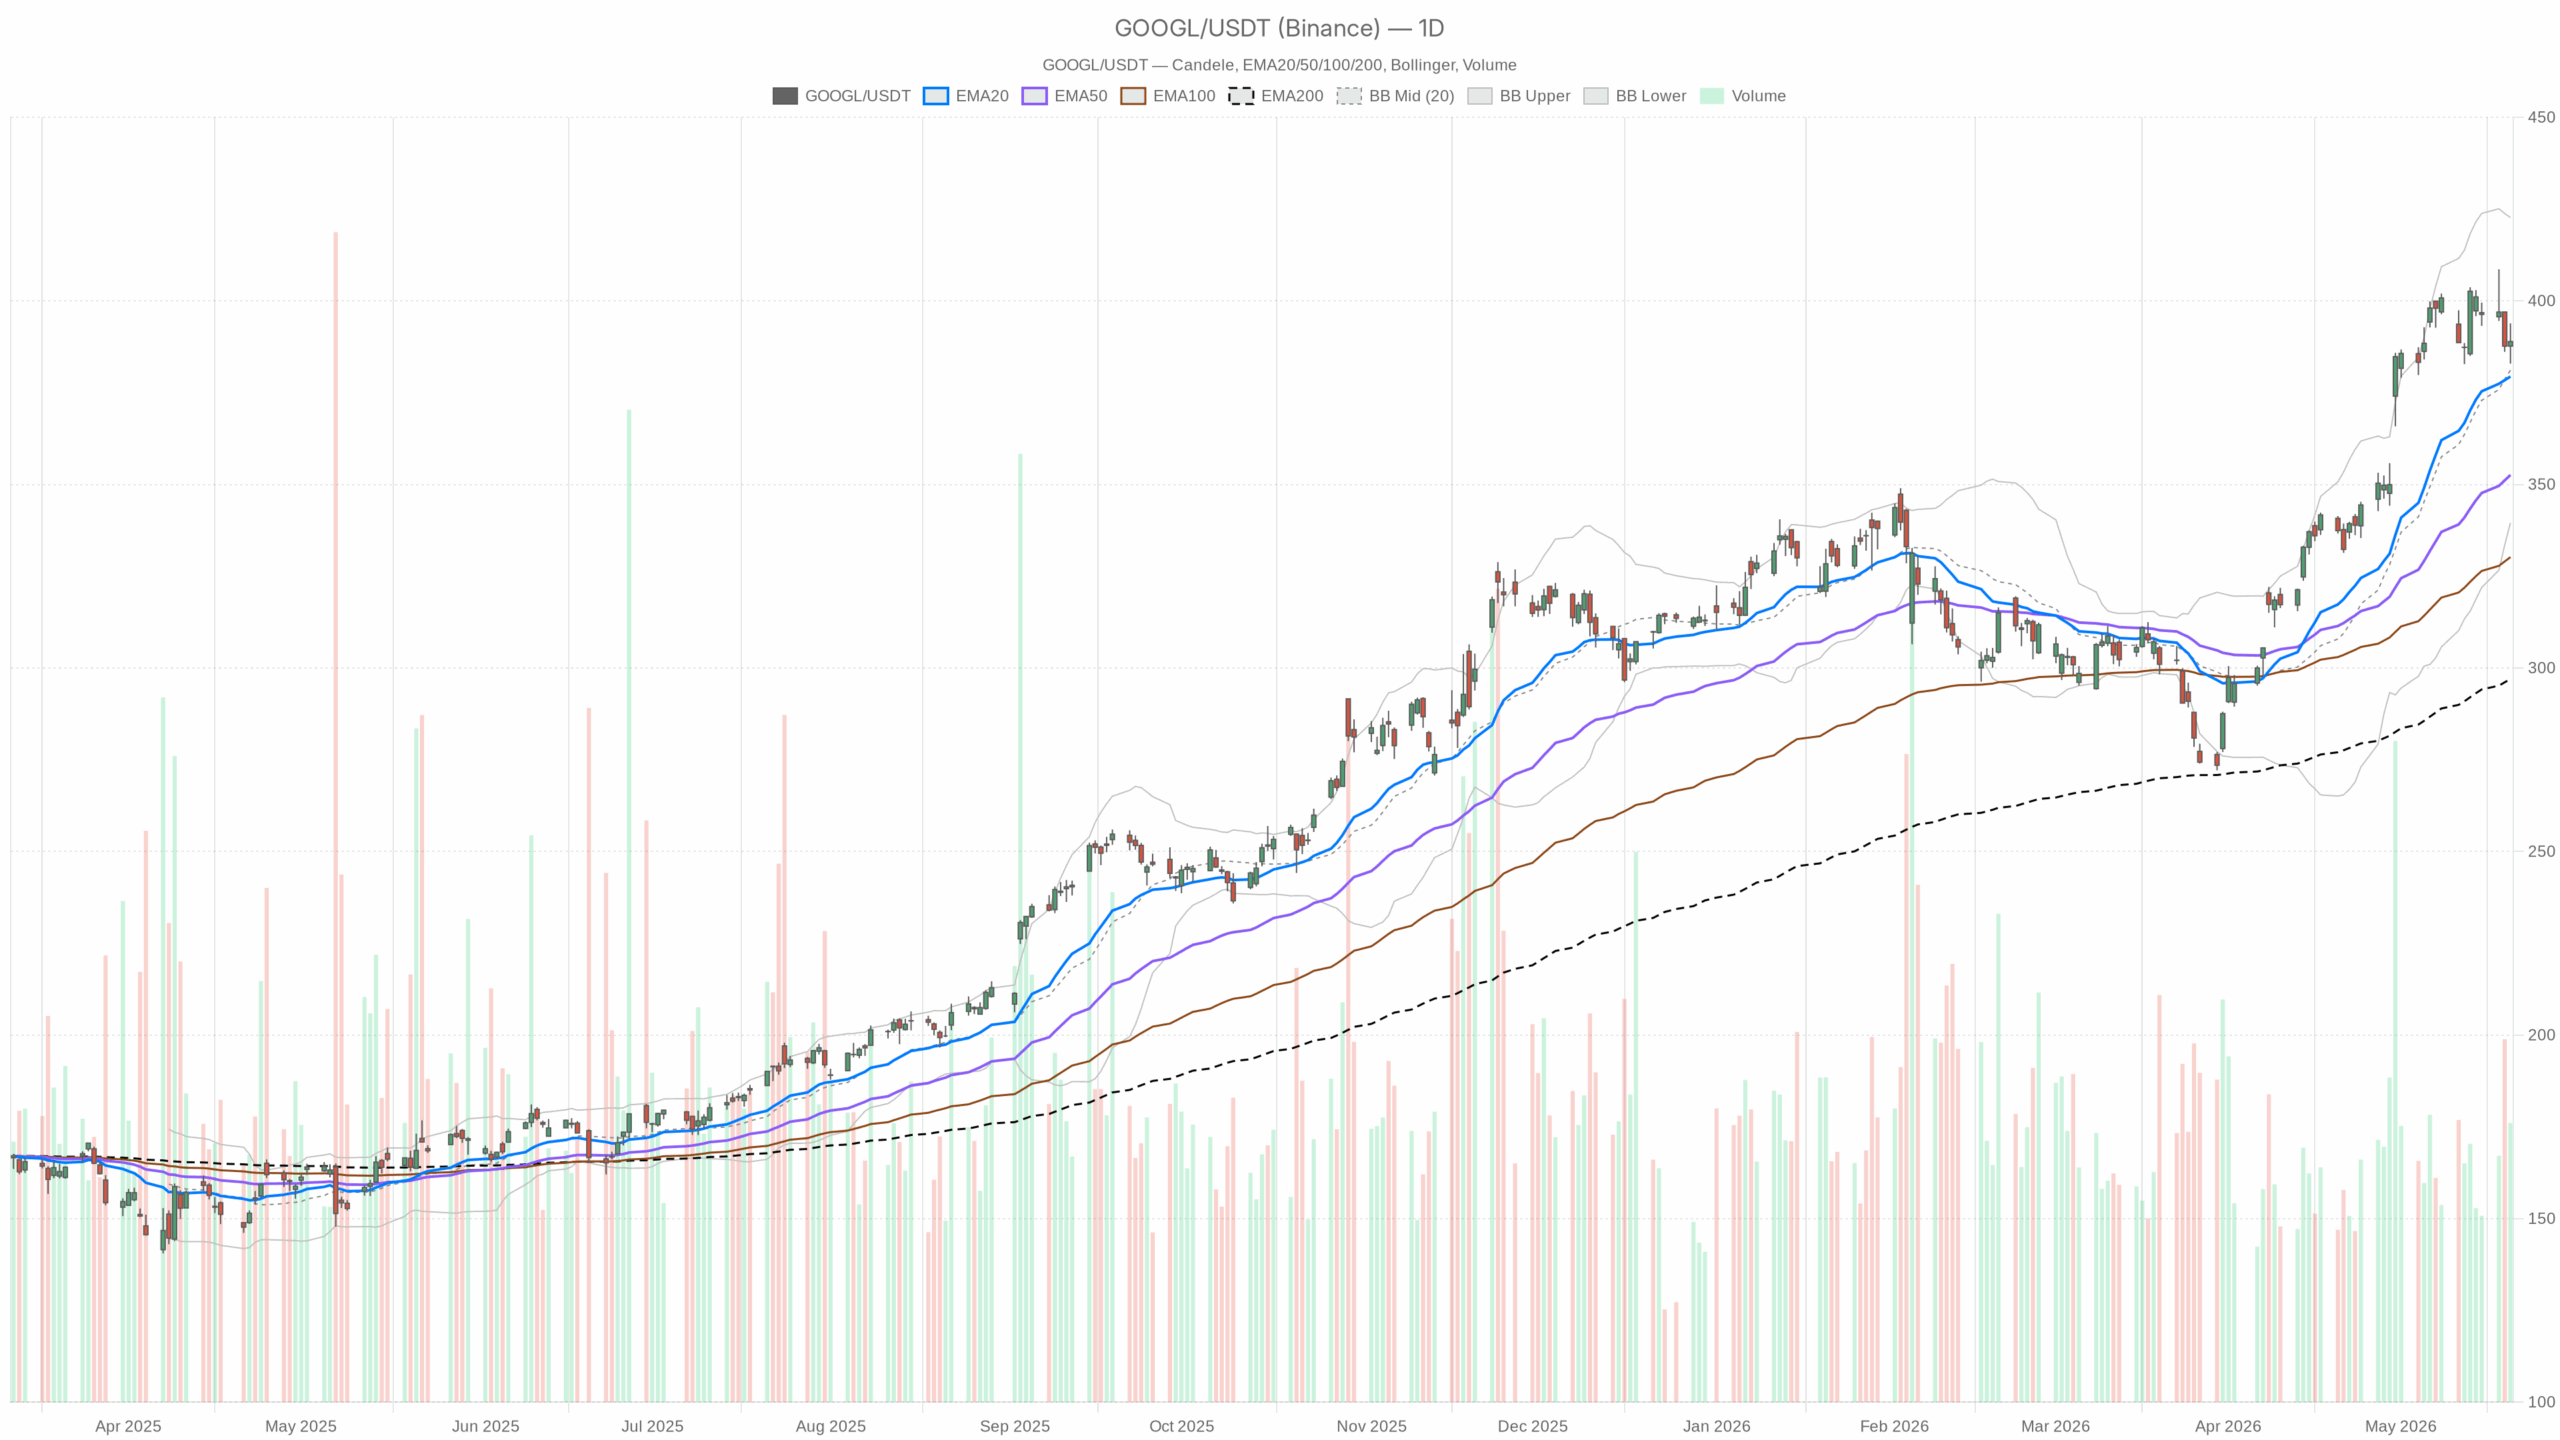
Alphabet Stock remains in a bullish daily trend, while the hourly tape digests gains below short-term moving averages. The primary bias is up, but near-term momentum needs a reset above 390–392 to unlock another attempt at the recent highs.
Summary
Daily Technical Outlook for Alphabet Stock
Trend and Moving Averages
On the daily chart, price closed at 388.91 and sits well above the 20/50/200-day EMAs at 379.40, 352.58, and 297.02. Interpretation: the primary uptrend is intact with layered support below.
Momentum and Volatility
Daily RSI(14) is 62.7. Interpretation: momentum is constructive without being stretched. Daily MACD shows a line of 16.52 versus a 18.74 signal and a -2.23 histogram. Interpretation: upside momentum is cooling, not reversing.
Daily Bollinger Bands center at 381.12 with the upper at 422.68 and lower at 339.55. Interpretation: price is riding the upper half, leaving room before the upper band. Daily ATR(14) is 9.81. Interpretation: typical day-to-day range risk is about $10.
Pivots and Near Levels
The daily pivot is 388.56 with R1 at 394.21 and S1 at 383.25. Interpretation: a close just above the pivot keeps buyers marginally in control, while 394 remains the near hurdle.
Hourly Pullback: Alphabet Stock Tests 390–392
Structure and EMAs
The 1H close at 388.88 is below the 20/50-hour EMAs at 390.13 and 392.04, while the 200-hour EMA lags far below at 368.81. Interpretation: near-term pressure persists within a broader uptrend.
Momentum and Range Context
1H RSI(14) prints 44.8. Interpretation: intraday momentum is mildly negative. 1H MACD sits at -2.71 versus a -2.59 signal with a -0.12 histogram. Interpretation: downside impulse is fading but not yet repaired.
1H Bollinger mid is 391.22 with bands at 402.93 and 379.51. Interpretation: price is operating in the lower half of its hourly range. 1H ATR(14) is 4.01. Interpretation: intraday swings near $4 can be expected.
Pivot Signals
The 1H pivot is 388.65 with R1 at 389.78 and S1 at 387.76. Interpretation: oscillation around the pivot signals indecision; reclaiming R1 would tilt the tape back to buyers.
15-Minute Tape: Micro Bounce Beneath the 200-EMA
Meanwhile, the 15m tape is stabilizing after the morning dip. The 15m close at 388.88 is above the 20/50-EMA at 387.02 and 388.68, while still below the 200-EMA at 392.90. Interpretation: short-term momentum has turned up, but the larger intraday trend remains capped.
15m RSI(14) is 60.55. Interpretation: buyers have regained the initiative in the micro time frame. 15m MACD is 0.07 versus a -0.48 signal with a 0.55 histogram. Interpretation: momentum has crossed positive, supporting a bounce.
15m Bollinger mid is 386.16 with the upper at 388.81 and lower at 383.52. Interpretation: price is pressing the upper band, consistent with a near-term push. 15m ATR(14) is 1.27. Interpretation: immediate swings are tight, suiting tactical entries.
The 15m pivot is 388.74 with R1 at 389.69 and S1 at 387.94. Interpretation: holding above the pivot favors quick tests of 389.69; a slip below S1 would negate the micro-bounce.
News Flow and Sentiment Around Alphabet Stock (GOOGL)
Notably, headlines remain mixed. A well-known billionaire reportedly rotated out of Alphabet into Microsoft, tempering sentiment at the margin. In contrast, coverage around Google I/O highlighted Gemini 2.5, AI shopping initiatives, and a higher capex plan, alongside bullish takes that frame Alphabet as a broad AI platform.
Citizens also reiterated a positive stance on the expanding search market. Interpretation: fundamental narratives are polarized but skew supportive, which fits a bullish daily trend with choppy intraday flows.
Bullish Scenario: Reclaim 390–392 and Target 400, Then 422.68
Therefore, the bullish scenario still dominates on the daily chart. A clean 1H reclaim of 390–392 (the 20/50-hour EMAs and the hourly mid-band near 391) would confirm momentum repair. Interpretation: that would align hourly dynamics with the daily trend.
A push through 389.78 (1H R1) and then 394.21 (daily R1) would open the path toward the psychological 400 area and, in time, the daily upper band near 422.68. Interpretation: successive resistance wins would re-accelerate the trend and invite follow-through buying.
Bearish Setup and Risk Markers
On the other hand, the bearish setup would gain traction if price loses the daily pivot at 388.56 and breaks 383.25 (daily S1). Interpretation: that would shift control to sellers and invite mean reversion toward the daily Bollinger mid at 381.12, roughly one ATR away.
A daily close below the 20-day EMA at 379.40 would more clearly invalidate the bullish case. Interpretation: breaking the primary moving average would mark a change in character from trend to distribution.
Multi-Timeframe Take and Positioning for Alphabet Stock
Overall, the timeframes disagree in a manageable way: the daily trend is up, the hourly is consolidating, and the 15m is rebounding. Consequently, confirmation above 390–392 matters for trend continuation, while 388.56 and 383.25 frame the downside risk.
With daily ATR near $10 and 1H ATR near $4, sizing and timing remain essential as volatility is moderate. Until the hourly tape resolves, positioning will likely favor tactical patience and quick reactions rather than broad directional bets.