




As of 25 May 2026, risk appetite is muted while Ethereum price today attempts a rebound into resistance, with the broader daily trend still pointed lower.
Ethereum (ETH) is trading around 2,118–2,119 today, staging a modest intraday rebound while the daily trend remains firmly lower. This matters because short-term momentum is pressing into a clear band of overhead resistance as broader crypto risk appetite is subdued. Bitcoin dominance sits high at 58.3%, and the Fear & Greed Index is at 30 (Fear). In other words, ETH is bouncing against the grain.
The dominant force right now is structure over momentum: the daily downtrend is intact, and rallies are being tested by sellers. The intraday bid can continue. However, unless bulls reclaim key daily levels, it looks more like mean reversion than a trend change.
Summary
Market logic, then evidence
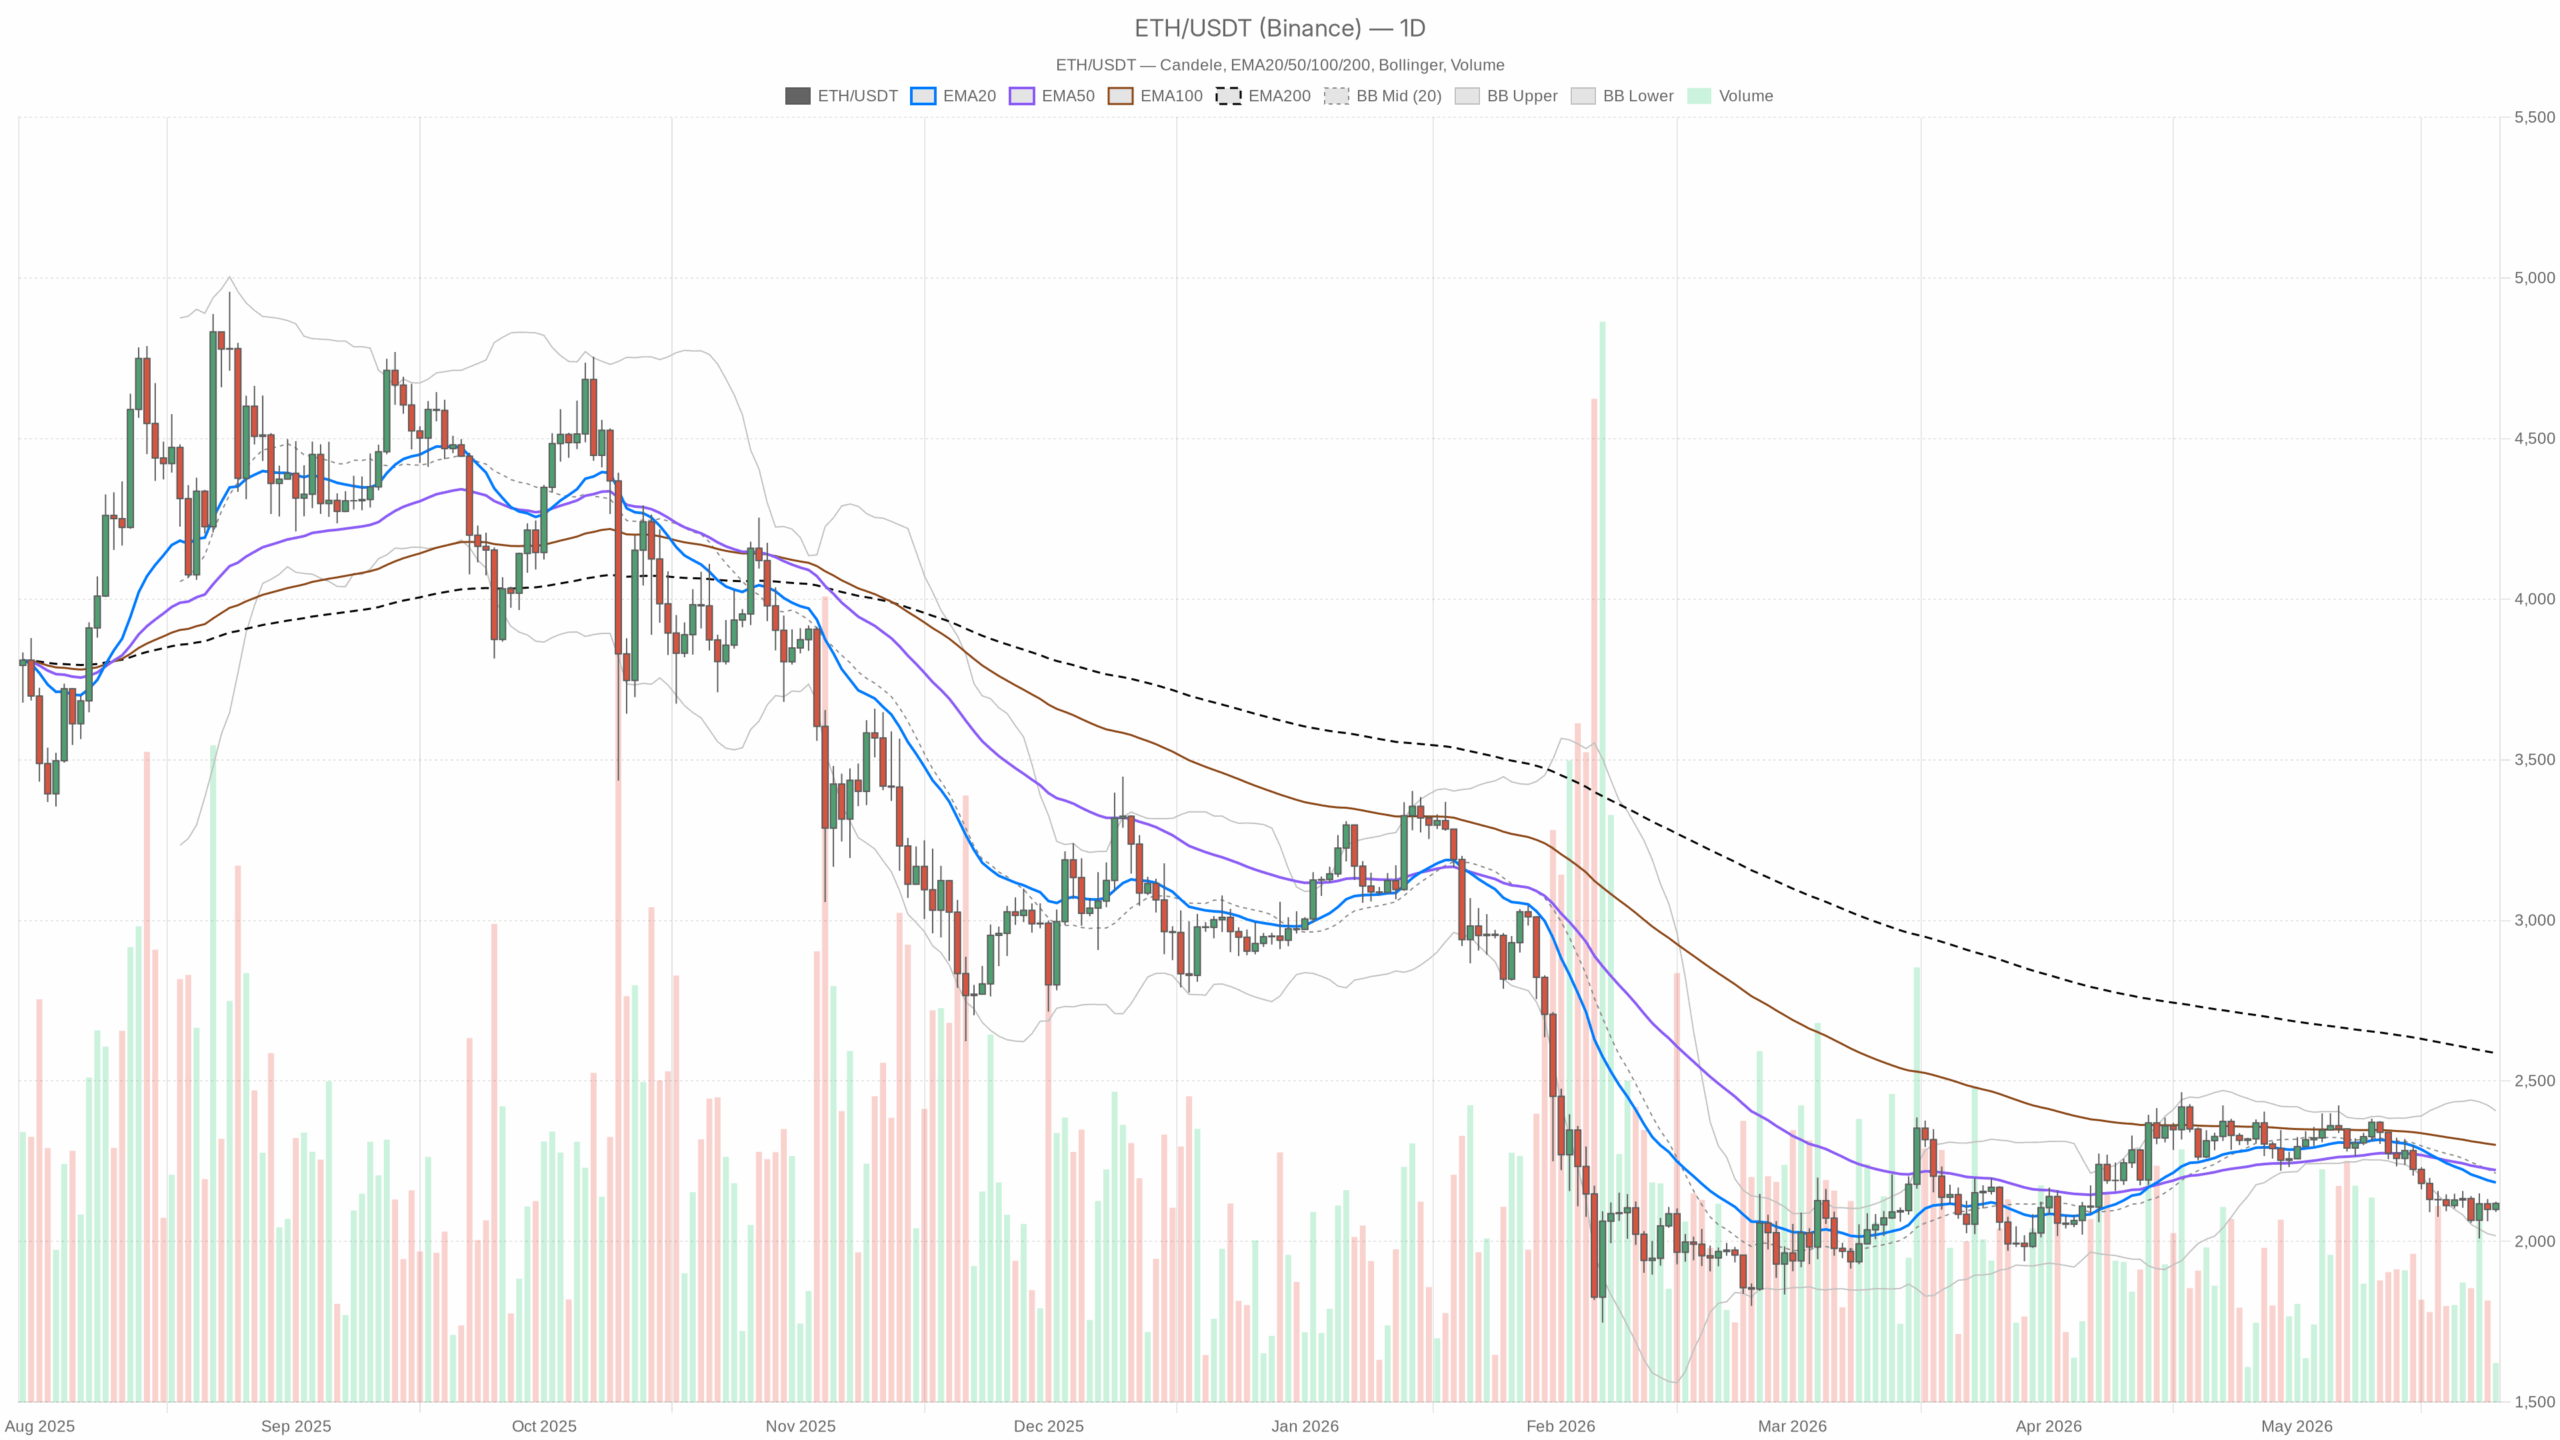
Daily (macro bias): bearish. Price is below the 20/50/200-day EMAs with bearish alignment, RSI is sub-50, and MACD is negative. That keeps the swing bias defensive. The one thing bulls have is room above the lower Bollinger Band, which allows for squeezes higher. However, those are counter-trend for now.
1H (tactical): neutral-to-firm. Price is above the 20/50-hour EMAs but still under the 200-hour EMA (~2,130). That is a classic rebound within a broader downtrend. Momentum is positive intraday, yet overhead supply sits immediately ahead.
15m (execution): constructive but stretched. Price rides above intraday EMAs and near the upper 15m Bollinger Band, so entries here risk buying into short-term exhaustion unless resistance breaks cleanly.
Daily indicator readout (with context)
- EMA (20/50/200): 2,183.82 / 2,222.39 / 2,586.59; price at 2,118.75 sits below all three with bearish stacking. Interpretation: trend pressure remains down; rallies are guilty until proven otherwise.
- RSI(14): 40.09. Interpretation: weak momentum but not oversold; there is room for a bounce, yet no evidence of a trend reversal.
- MACD: line -50.78 vs signal -38.55, hist -12.23. Interpretation: negative and widening; sellers still control the higher timeframe tape.
- Bollinger Bands (20,2): mid 2,212.36, upper 2,407.03, lower 2,017.69. Interpretation: trading in the lower half of the band; downside risk remains to ~2,018 if the bounce fails.
- ATR(14): 77.22. Interpretation: daily swings of ~$75–$80 are normal right now; expect noisy back-and-forth near levels.
- Daily Pivots: PP 2,111.70, R1 2,131.15, S1 2,099.31. Interpretation: price is hovering just above PP and below R1; 2,131 (R1) aligns with key intraday resistance.
Intraday evidence (to validate or fade the bounce)
- 1H EMAs: 20/50 at 2,105.95 / 2,102.73 (below price), 200 at 2,130.14 (above price). Interpretation: near-term bid, but the 200h EMA around 2,130 is the line in the sand.
- 1H RSI/MACD: RSI 59.1, MACD positive. Interpretation: momentum favors a push into resistance; failure there risks a quick fade.
- 1H Bollinger: upper band ~2,122 with price pressing it. Interpretation: short-term stretch; break-and-hold above opens 2,130.
- 15m setup: EMAs rising with RSI ~62 and price near the upper band. Interpretation: constructive micro uptrend but vulnerable to pullbacks unless 2,120–2,131 clears decisively.
Key levels and market structure
Immediate resistance: 2,120–2,131 (15m pivot 2,120.15, 1H upper band ~2,122, daily R1 2,131, 200h EMA ~2,130). A clean break-and-hold above this cluster would validate the intraday squeeze.
Next resistance: 2,184–2,225 (daily EMA20 2,183.82, BB mid 2,212.36, EMA50 2,222.39). That said, this is the battleground for flipping the daily trend from pressure to neutral.
Support: 2,111–2,099 (daily PP/S1), then 2,018 (daily lower Bollinger). Lose S1 and the path of least resistance reopens lower.
Scenarios
Bullish (counter-trend for now): If ETH pushes through 2,130–2,131 and holds above it on the 1H, momentum can carry toward 2,165–2,185 and then 2,210–2,225. A daily close above ~2,184 (EMA20) starts to neutralize the downtrend; above ~2,222 (EMA50) invites a broader trend rebuild.
Invalidation for the bullish path: a rejection from 2,130–2,131 followed by a break back below 2,111–2,099. That would indicate the bounce was a squeeze, not accumulation.
Bearish (with the daily trend): Failure under 2,130–2,131 and a drop through 2,111–2,099 exposes 2,050–2,020, with 2,017–2,018 (lower Bollinger) the obvious downside magnet. Continued negative MACD on daily would support lower lows.
Invalidation for the bearish path: sustained 1H closes above 2,131 and a daily close back over ~2,184. That would mark a shift from selling rips to buying dips.
Positioning thoughts
With Ethereum price today pressing into resistance while the daily structure stays bearish, swing traders generally have better odds fading strength into the 2,130 area and again toward 2,185–2,225 unless the daily closes reclaim those levels. Intraday participants can ride the squeeze. However, they should respect the confluence at 2,130 and the typical ~$75–$80 daily volatility when sizing risk.
Meanwhile, sentiment is still in Fear, BTC dominance is elevated, and DeFi fee activity has cooled across major DEXs. That backdrop tends to cap alt rallies until proven otherwise.
Bottom line: this is a bounce inside a downtrend. If 2,130 flips to support and the daily pushes back above 2,184–2,225, the picture improves. Otherwise, sellers likely reassert into the same resistance that is now being tested.
