

Mastercard stock faces significant selling pressure as June begins, with clear bearish signals dominating the daily chart. MA closed at $477.68 on June 2, matching its session low, indicating sustained weakness rather than a temporary pullback. Trading below all major exponential moving averages, the trend strongly favors further downside unless buyers intervene decisively.
Summary
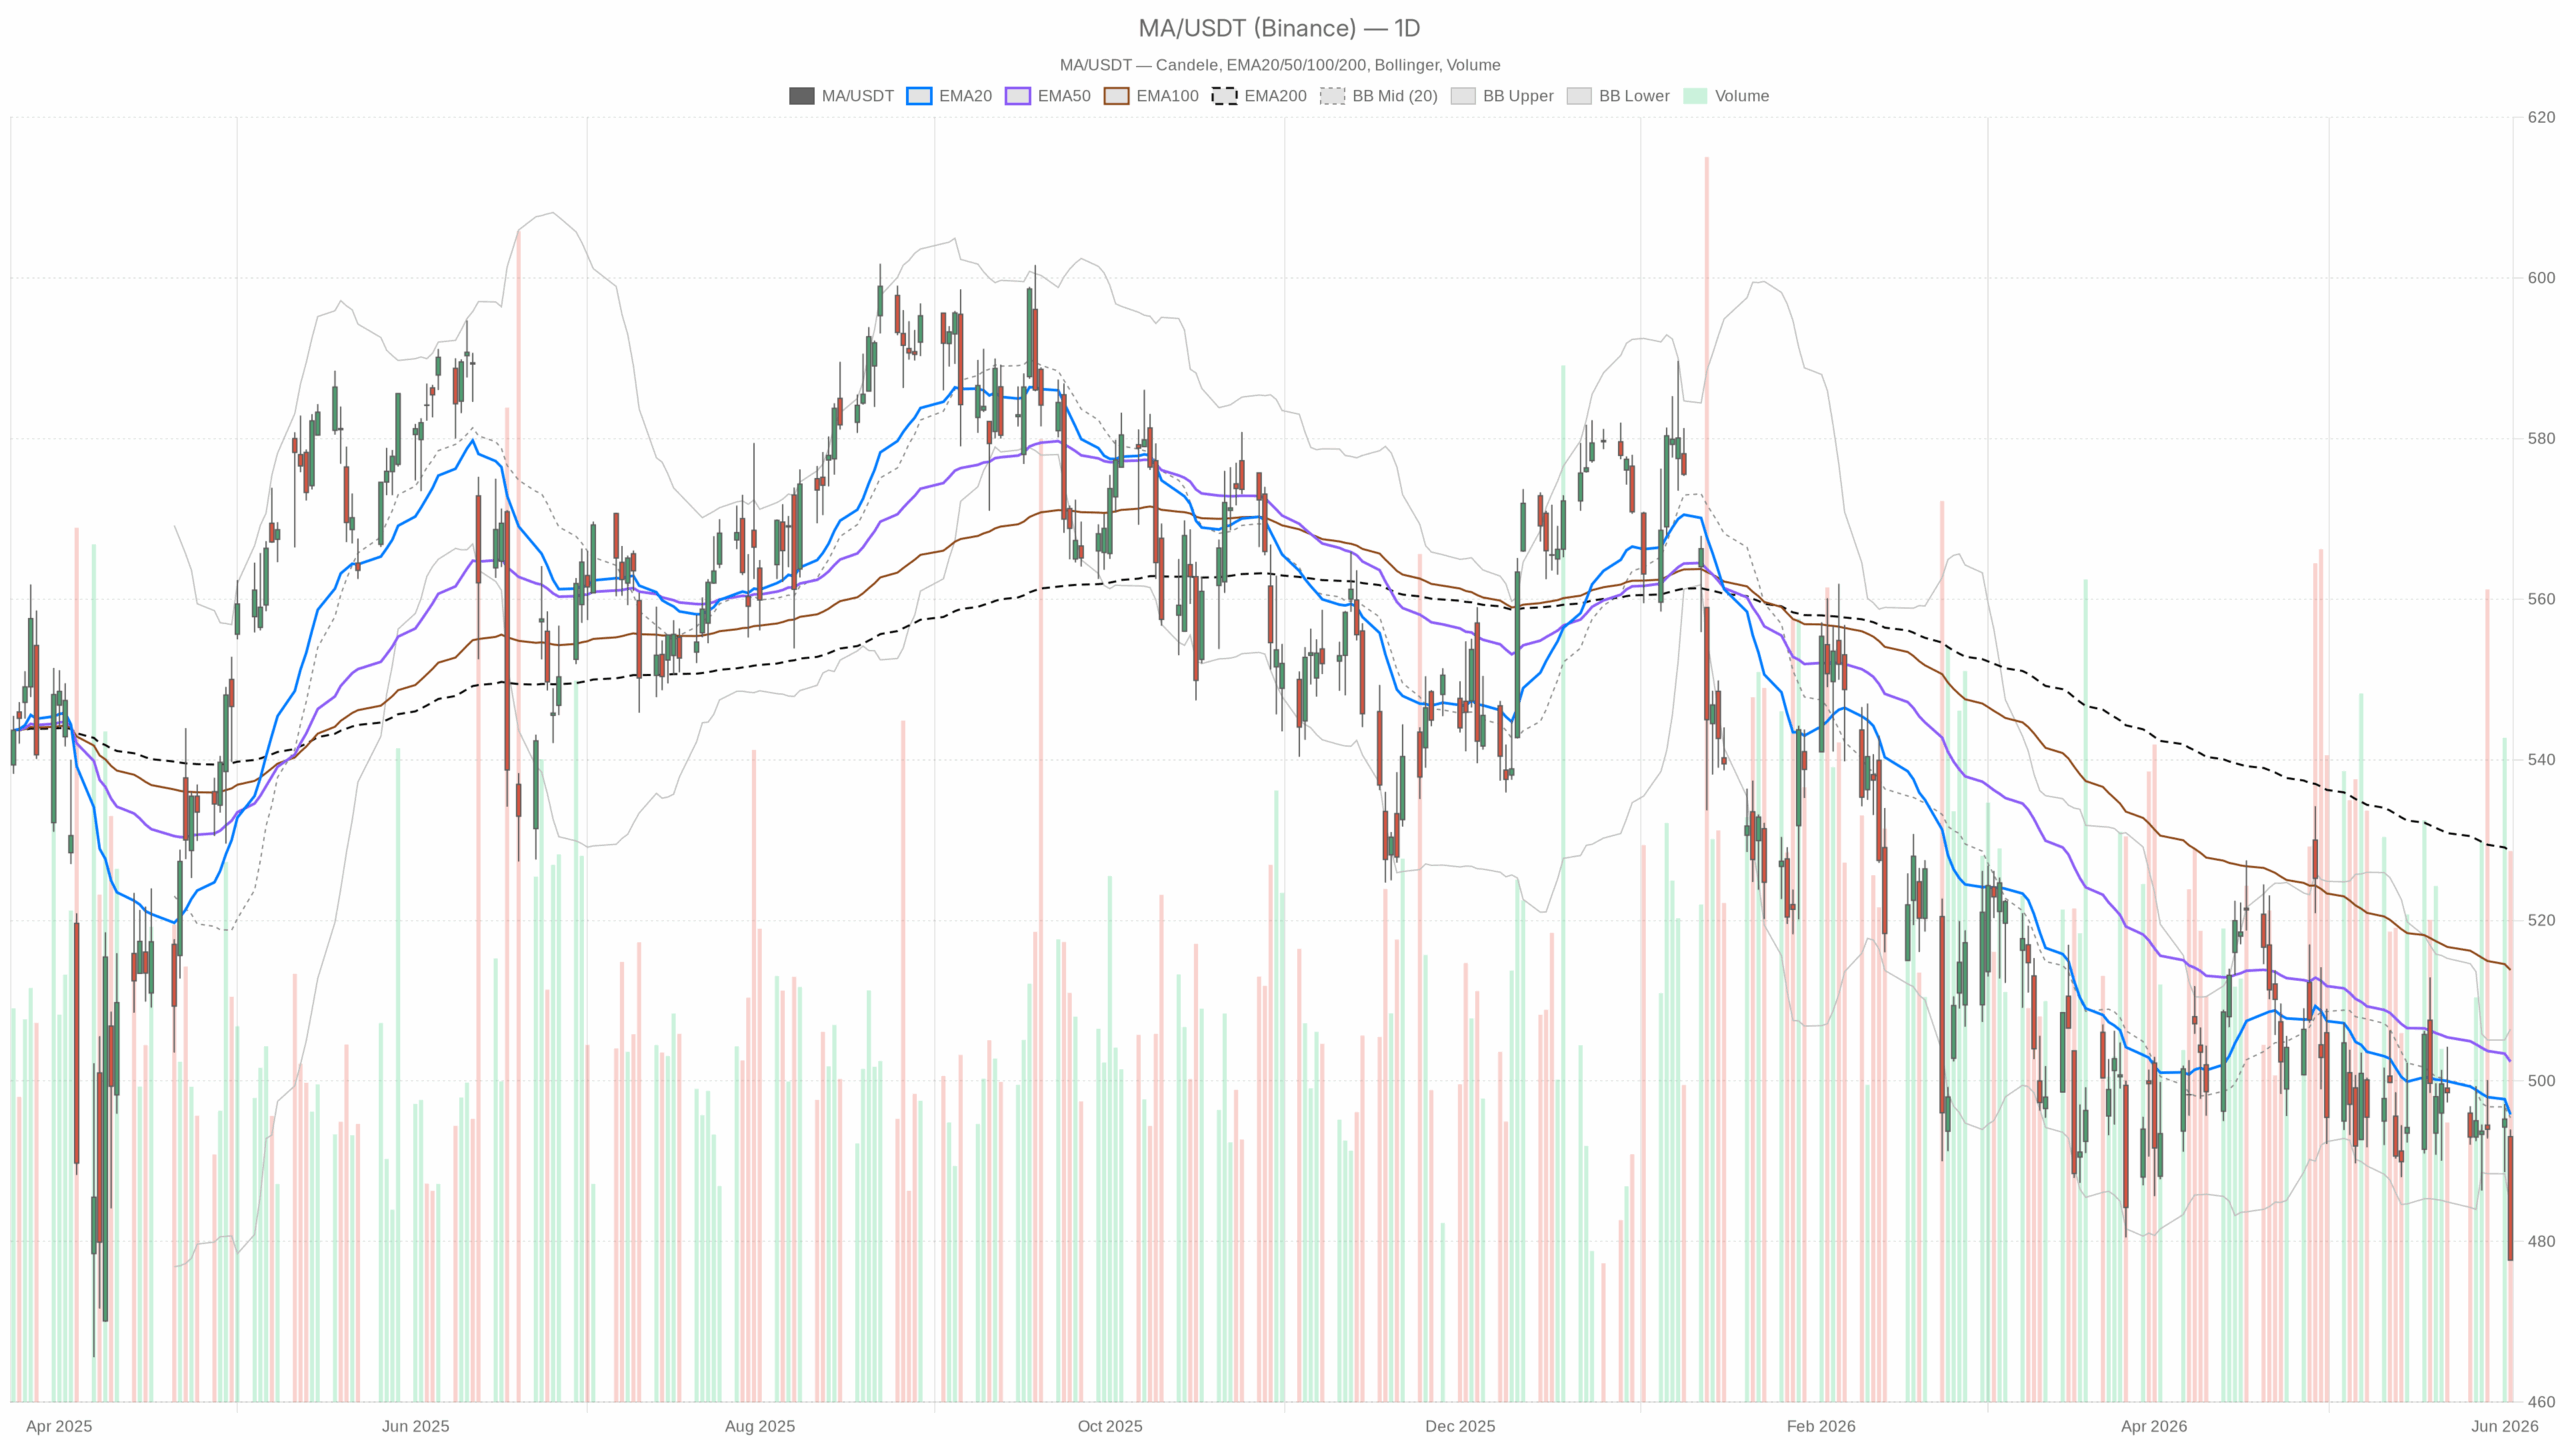
Mastercard Stock Bears Control the Daily Trend
The daily chart shows an unmistakably bearish regime. The 20-day EMA stands at $495.81, the 50-day at $502.39, and the 200-day at $528.57—each well above the current price of $477.68. This alignment signals a broad and institutional-level downtrend rather than isolated volatility.
Further confirming this view, the daily RSI at 35.53 is near oversold but remains above the critical 30 threshold. Momentum is weakening but has not yet triggered mechanical bounce signals relevant for shorter-term traders. The MACD supports this bearish momentum: its line at -3.80 is below the signal at -2.75, with a widening negative histogram of -1.04. This suggests accelerating downward momentum.
Indicators Reinforce the Bearish Outlook for Mastercard Stock
Bollinger Bands add important context. The daily mid-band at $495.41 contrasts with a closing price of $477.68—well below even the lower band of $484.36. Such extended moves typically precede either short-term bounces or sustained breakdowns. Given the prevailing trend and momentum, a continued breakdown is more likely.
The daily Average True Range of $10.03 reflects elevated volatility, emphasizing the risk involved regardless of direction. Daily pivot analysis places support at $472.26 and resistance at $488.53, with the pivot point at $483.10. Currently trading below the pivot emphasizes a technically bearish posture consistent with the broader downtrend.
Hourly Chart Confirms Bearish Pressure on Mastercard Stock
The intraday hourly chart supports the bearish thesis. The 1H close at $477.84 lies below the 20-period EMA at $487.97, the 50-period at $491.99, and the 200-period at $497.73. This full EMA stack aligns bearishly. Moreover, the hourly RSI has dropped to 27.97, entering oversold territory. This suggests the short-term selloff might be overstretched, potentially setting up for a relief rally.
However, the hourly MACD does not back any recovery; its line at -3.80 versus a signal of -2.32 yields a deeply negative histogram of -1.47. Without positive divergence or flattening in the MACD histogram, the oversold RSI alone is unlikely to prompt a sustained bounce. The hourly Bollinger lower band at $476.96 closely hugs the price, reinforcing the intact downtrend within the intraday frame.
Short-Term Execution Context on the 15-Minute Chart
Examining the 15-minute chart reveals a faint signal: the MACD histogram has turned slightly positive at +0.11 despite depressed pricing levels. This micro-divergence may indicate short-term consolidation or a tentative support test. Nonetheless, it does not alter the overall bearish outlook. The 15-minute RSI remains near oversold at 29.37, and all three EMAs—the 20 at $482.43, 50 at $486.33, and 200 at $492.30—sit well above current price. Any meaningful stabilization here requires confirmation at the hourly level first.
Fundamental Factors and Recent News Impacting Mastercard Stock
The fundamental picture presents mixed signals without alarming concerns. TD Cowen maintains a Buy rating and a $671 price target after Mastercard’s strong Q1 growth of 12%, highlighting a gap between current technical weakness and positive longer-term fundamental outlook.
Strategic initiatives such as Mastercard’s shift toward cryptocurrency and real-time payments, including involvement in the Eurosystem’s TIPS pilot for instant cross-currency settlements, support a constructive long-term thesis.
Conversely, recent leadership changes effective August 3 create short-term uncertainty. Additionally, Berkshire Hathaway’s exit from its longstanding position adds pressure, contributing to the recent technical decline amid increased risk repricing.
Scenarios for Mastercard Stock: Bullish and Bearish Outlooks
Bullish Scenario
The bullish case depends on reclaiming the $483–$488 resistance zone, which aligns with the daily pivot area. Surpassing this range would target the Bollinger mid-band at $495.41 and the 20-day EMA at $495.81. A sustained close above $496 could begin shifting the daily trend from bearish to neutral at minimum. Strong revenue growth, analyst confidence, and innovative product strategies support this recovery scenario. Also, oversold RSI levels across timeframes increase the likelihood of a near-term technical bounce.
Bearish Scenario
If Mastercard fails to hold the $472–$476 support zone, the bearish outlook would strengthen considerably. The daily S1 support at $472.26 acts as a key level; a decisive break below it may push price toward the $460s, where chart support is sparse. This scenario would reinforce negative narratives tied to leadership uncertainty and Berkshire’s exit, potentially accelerating the selloff. The MACD trend would likely worsen, aligning with this extended bearish case.
Conclusion: Mastercard Stock Remains Technically Vulnerable
Overall, Mastercard stock appears technically impaired across all key timeframes. Daily and hourly charts confirm a bearish regime, while only tentative short-term signals emerge on the 15-minute frame. Elevated volatility and a wide ATR demand cautious positioning, given asymmetric risk. A significant disconnect exists between the current share price and analyst targets, reflecting tension between near-term technical weakness and longer-term fundamental optimism. Until the daily chart recovers above key EMA support, bears maintain control and the onus is on bulls to prove otherwise.