

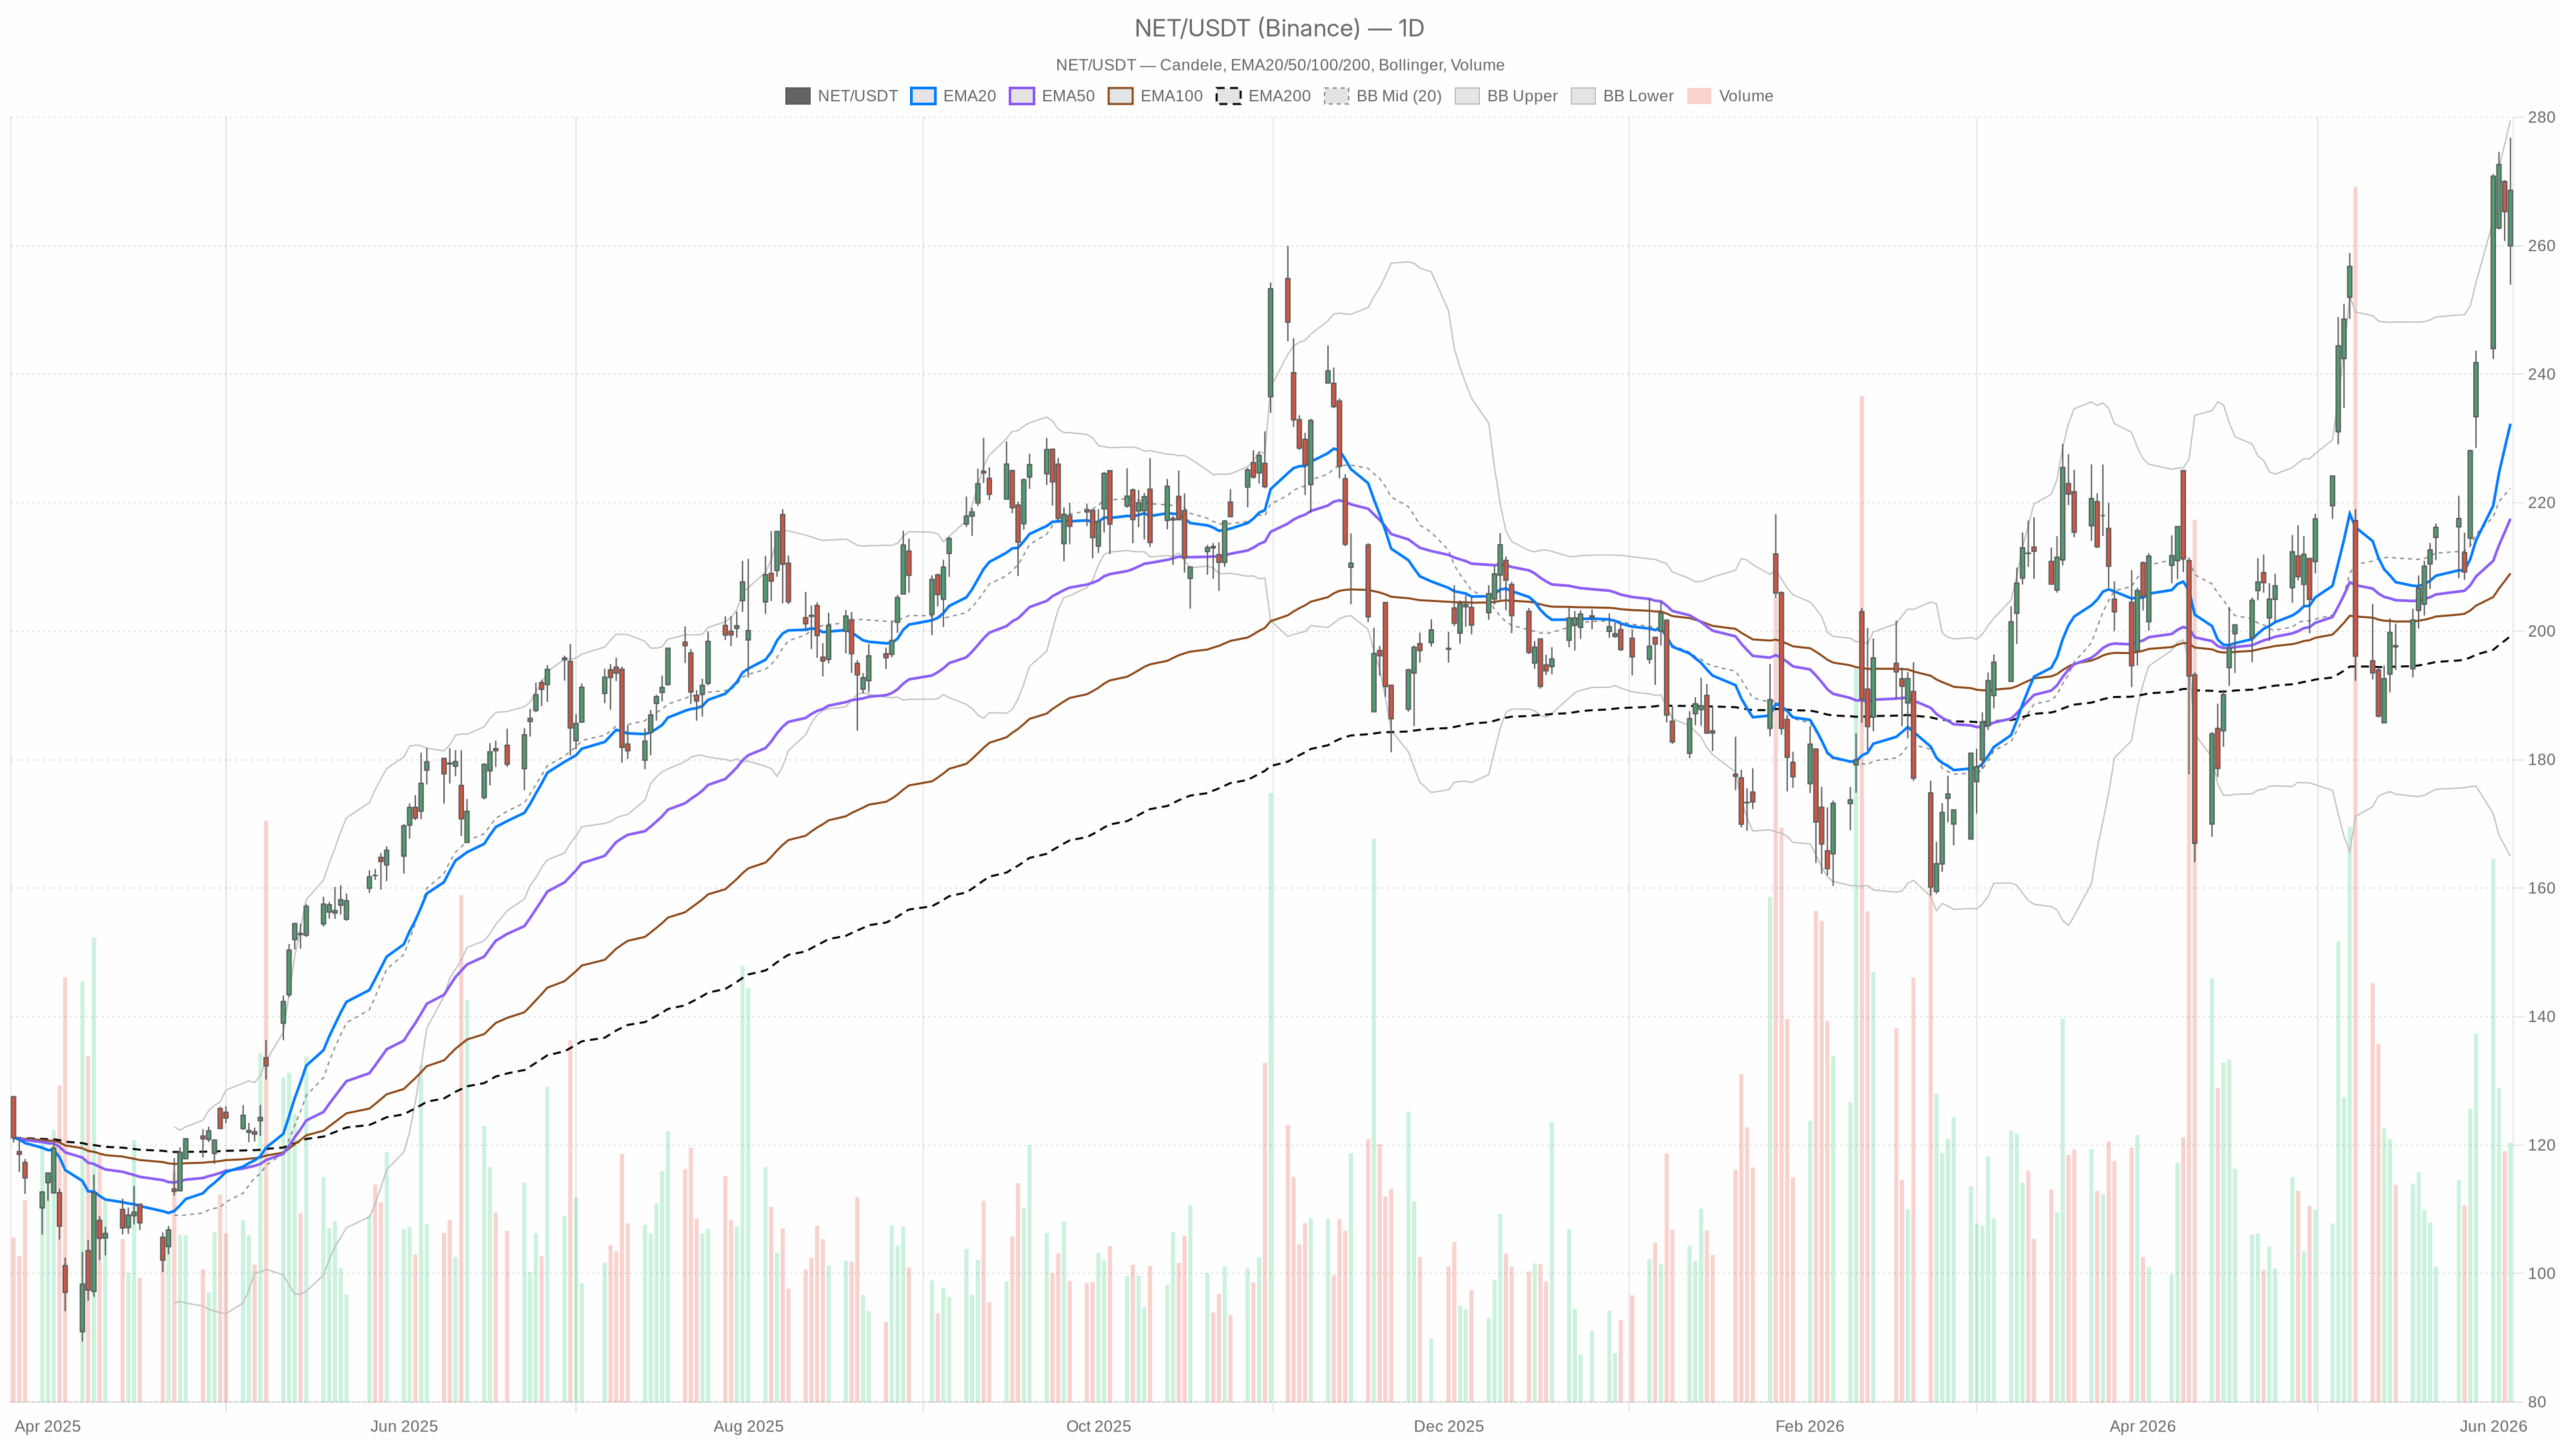
Cloudflare stock (NET) continues its strong uptrend, supported by a constructive daily chart that keeps bulls in control. Closing at $268.64 on June 4, 2026, NET trades above key averages while facing resistance near its daily Bollinger Band upper boundary.
Summary
Daily Chart Shows Strong Uptrend for Cloudflare Stock
The daily timeframe confirms an unambiguous bullish trend. The EMA20 stands at $232.31, EMA50 at $217.51, and EMA200 at $199.23, all aligned in bullish order. Price maintains a significant premium above these averages, reflecting sustained buying pressure over several weeks. The daily MACD supports this strength, with a line at 14.82, signal at 8.16, and a positive histogram of 6.65, indicating expanding momentum and limited seller control.
Near Overbought Conditions and Key Resistance Levels
However, the daily RSI at 68.35 edges toward overbought territory, signaling a mature but ongoing trend. The daily ATR of $12.92 points to meaningful intraday volatility. The upper daily Bollinger Band at $279.52 is close to the session high of $276.81, forming immediate resistance. Despite attempts, Cloudflare stock has yet to close convincingly above this level.
Pivot Points Highlight Critical Levels
Daily pivot analysis places the pivot point at $266.47, with resistance R1 at $278.99 and support S1 at $256.12. The close of $268.64 above the pivot is constructive but not yet decisive. A move toward R1 and a breakout above the upper Bollinger Band would likely require fresh catalysts to sustain momentum.
Intraday Charts Reveal Softening Momentum Challenges
Hourly Chart Shows Diverging Momentum
The 1H chart reveals some momentum friction despite remaining bullish. The EMA20 at $267.38 and EMA50 at $253.07 still support price, but the hourly MACD has turned negative. Its histogram reads -1.2, with the MACD line at 5.64 dropping below the 6.84 signal. This divergence indicates softened intraday buying pressure, though it does not negate the broader daily trend.
The hourly RSI at 58.92 reflects moderate bullishness without overextension. Price sits within the hourly Bollinger Band, currently between $261.80 and $277.88, with a close near the lower band half suggesting some mean-reversion pressure. The hourly pivot support at $267.10 emerges as an important near-term floor.
15-Minute Chart Warns of Short-Term Pullback Risk
On the 15-minute chart, caution becomes more pronounced. The regime is neutral with price below the 15m EMA20 of $272.08 and trading near the EMA50 at $269.79. The RSI has dropped sharply to 39.34, just above oversold, while the MACD histogram is negative at -0.72 with a bearish cross. Price closing below the lower Bollinger Band at $270.55 signals likely continuation of the intraday pullback unless buyers quickly intervene.
Fundamental and Sector Context for Cloudflare Stock
Fundamental sentiment around Cloudflare remains cautiously optimistic. Recent analyst updates held price targets steady, indicating unchanged expectations. This static outlook suggests current gains are driven more by price action and sector momentum than by fresh upgrades.
In contrast, peer Netskope (NTSK) fell 22% after earnings despite beating estimates, hit by weak free cash flow and CFO transition concerns. This reaction underscores the market’s current intolerance for any fundamental disappointments. Cloudflare faces a high bar in its upcoming catalysts to sustain momentum.
Potential Scenarios for Cloudflare Stock Trend
Bullish Scenario: Sustained Uptrend and Breakout Potential
The bullish case depends on preserving the daily trend structure. If Cloudflare stock can reclaim the $273–$275 intraday range and close above the daily pivot at $266.47 on strong volume, a test of resistance R1 at $278.99 is plausible. Clearing the daily Bollinger Band upper limit at $279.52 would mark a significant breakout, supported by the positive daily MACD and EMA stack. A dip staying above the $256 daily S1 would keep this bullish thesis intact.
Bearish Scenario: Intraday Weakness and Risk of Pullback
Bearish momentum would grow if the hourly MACD divergence deepens and price fails to regain the $267.10 hourly pivot. Sustained trading below this level could trigger a retest of the $256 daily support, increasing mean-reversion risk. Although short-term oversold signals on the 15m chart allow for a bounce, persistent selling could widen the gap to the daily EMA20 at $232, exposing Cloudflare stock to a broader downturn.
Conclusion: Cloudflare Stock Maintains Uptrend but Faces Short-Term Tests
Overall, Cloudflare stock remains in a strong structural uptrend on the daily chart, with bulls clearly in command. However, short-term signals—including a negative hourly MACD, neutral 15m regime, and resistance near the upper Bollinger Band—indicate the next upward move will require consolidation and absorption of selling pressure. Investors should approach current levels with patience. The prevailing trend favors buyers, but momentum indicators warn of elevated timing risk. Volatility remains significant, as confirmed by the $12.92 daily ATR, underscoring the need for disciplined positioning.