

Lululemon stock faces persistent pressure, with the recent earnings release deepening the ongoing selloff. Trading at $124.92 as of June 4, LULU has sharply broken below key moving averages on all timeframes, confirming a bearish technical outlook coupled with declining fundamentals and leadership uncertainty.
Summary
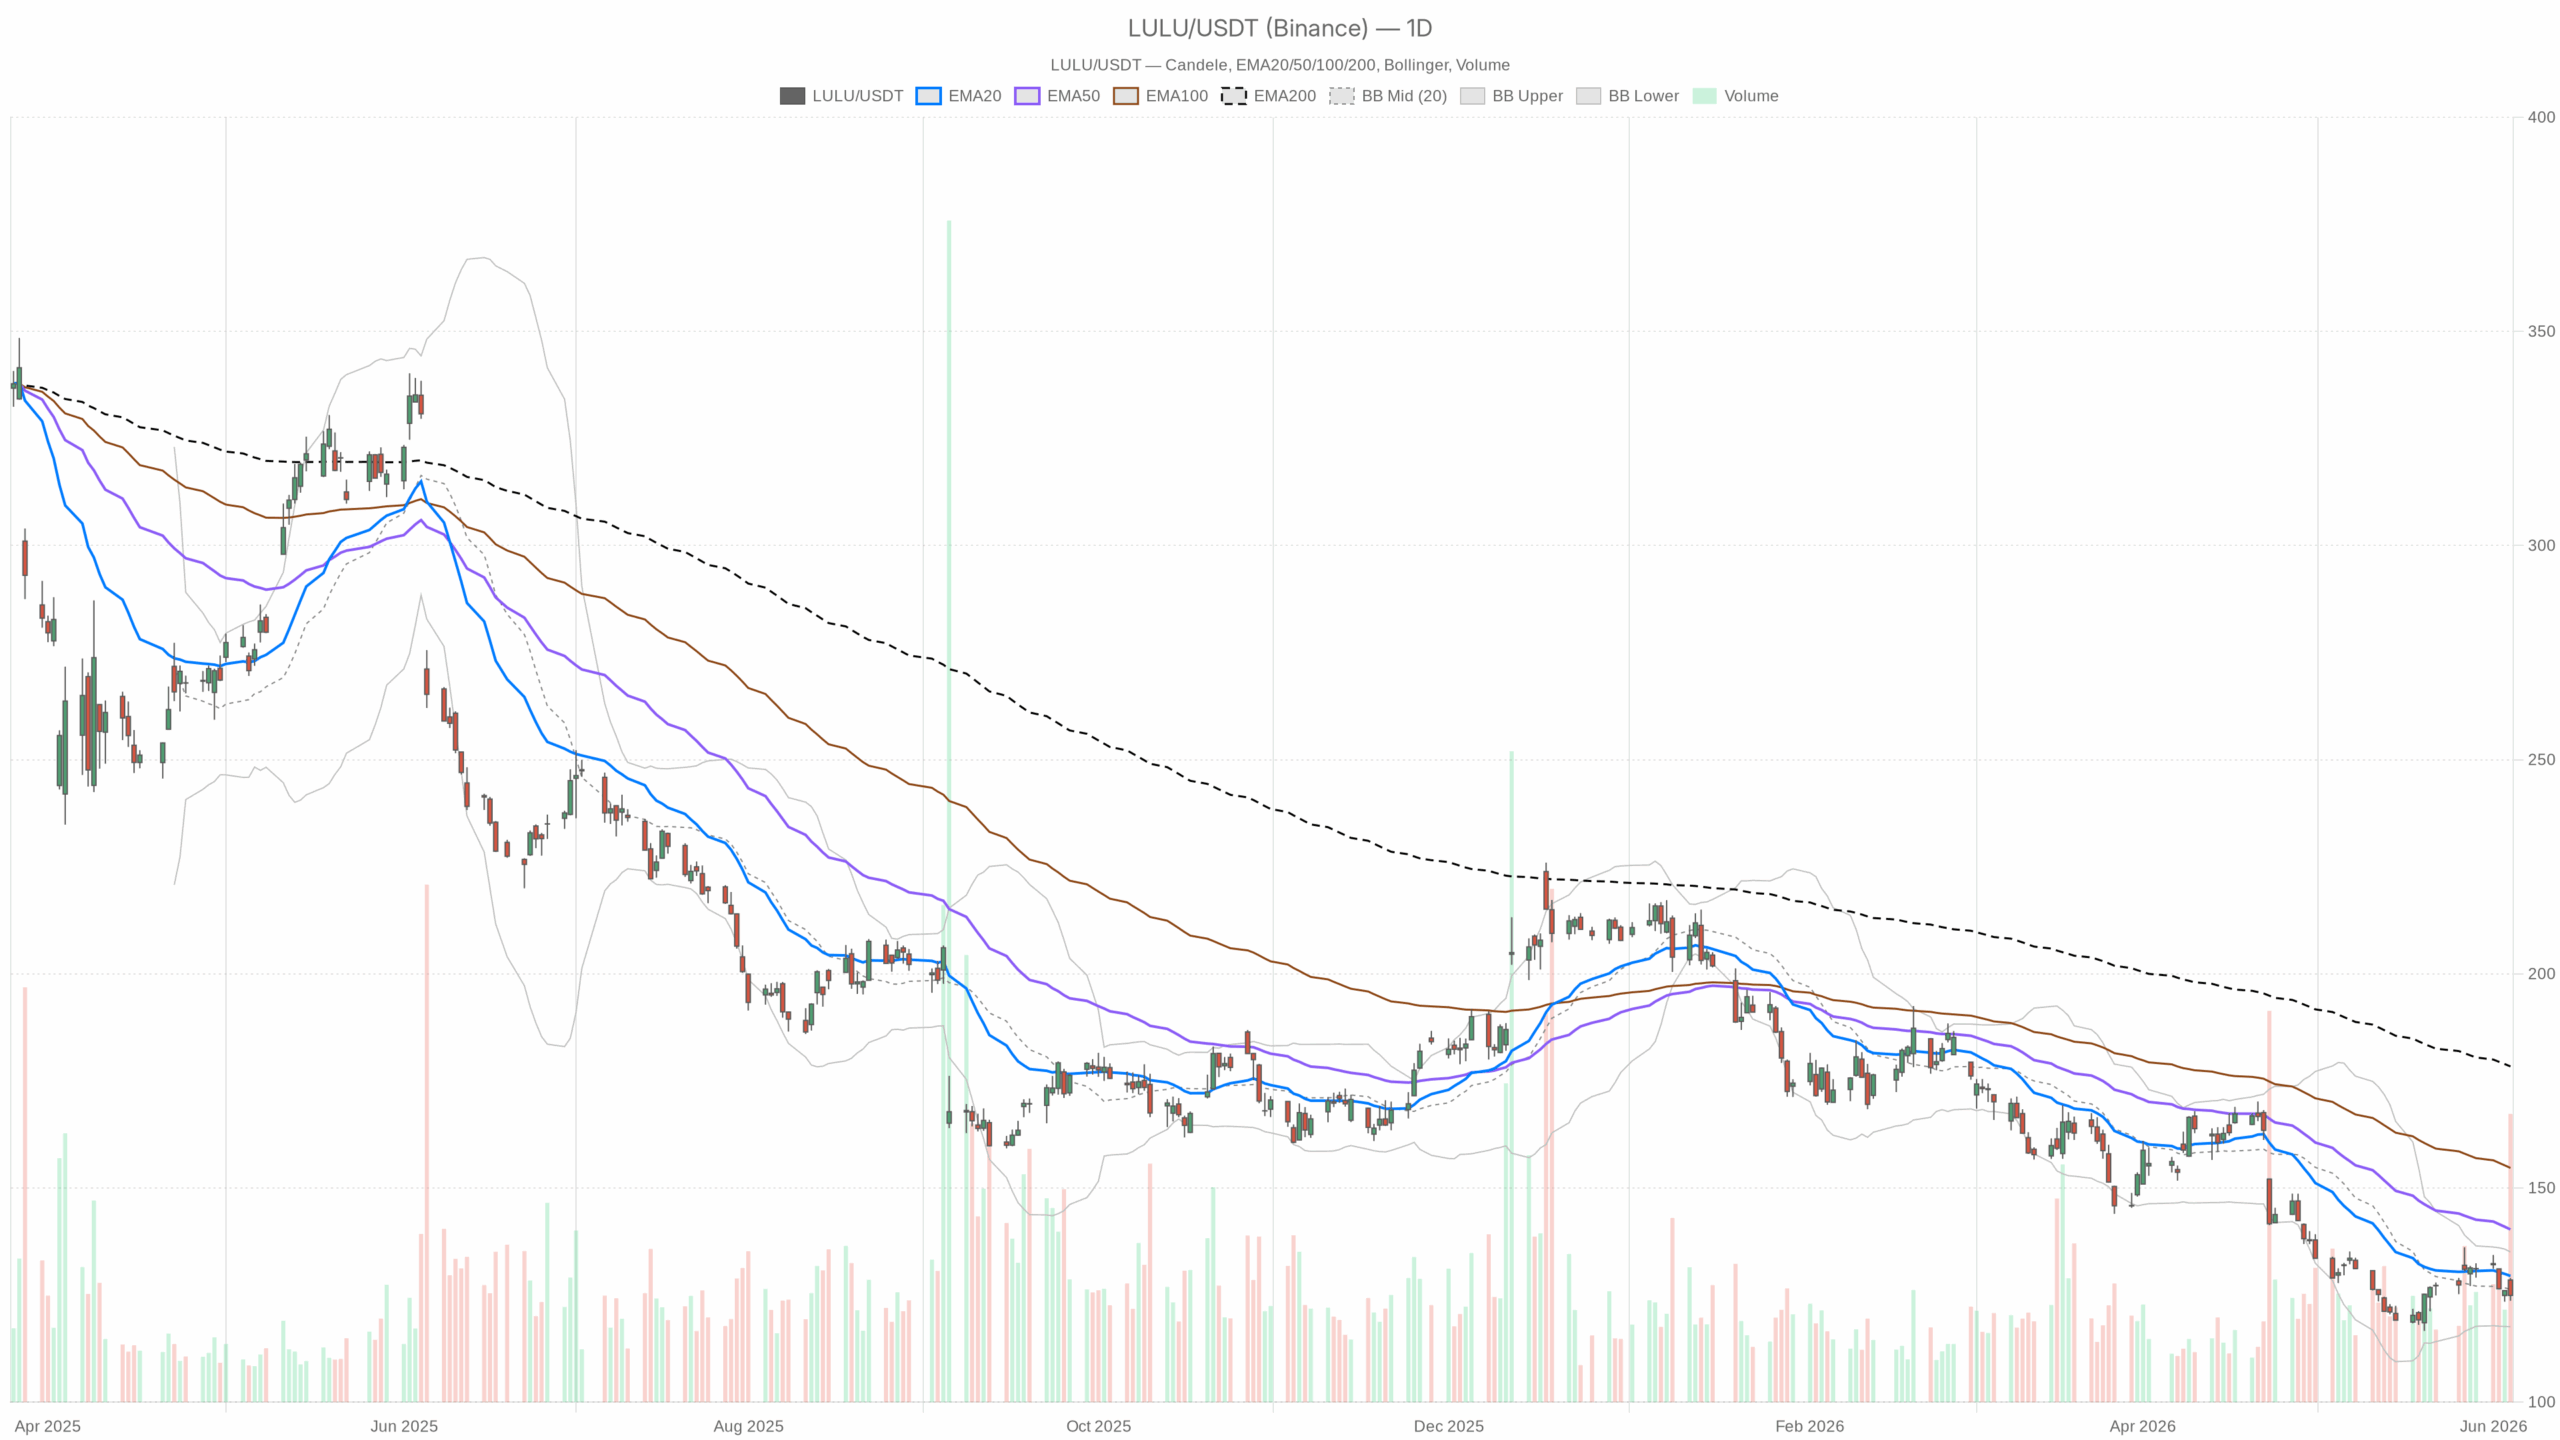
Lululemon Stock Technical Downtrend Across Timeframes
Daily Chart Confirms Strong Bearish Momentum
LULU closed well below its EMA20 at $129.46, EMA50 at $140.32, and EMA200 at $178.39, creating a stacked bearish alignment. This confirms a deeply entrenched downtrend. No significant technical support currently exists, as the stock trades under major dynamic levels. The daily regime classification is unambiguously bearish.
The daily RSI stands at 37.85, near oversold territory, but not low enough to typically trigger sharp reversals. This suggests sustained selling pressure rather than a bounce. Meanwhile, the MACD line at -3.81 remains below the signal line at -5.08, but the histogram has ticked positive to +1.26. This divergence hints at modest deceleration in bearish momentum, not a reversal.
Volatility and Support Levels on Daily Timeframe
Bollinger Bands show the midline at $126.33 with the stock below it, and the lower band at $117.62 serves as the next technical target if selling accelerates. The ATR reading of 4.68 indicates elevated daily volatility, meaning price swings of $4 to $5 per session are common. This adds risk for trade execution at current levels.
Pivot analysis places the daily pivot at $125.86, with resistance (R1) at $128.06 and support (S1) at $122.73. Closing below the pivot at $124.92 signals technical weakness and challenges intraday recovery efforts.
Intraday Confirmations of Bearish Pressure on LULU
One-Hour Chart Aligns with Bearish Daily Trend
LULU trades below its 1H EMA20 ($126.42), EMA50 ($127.51), and EMA200 ($132.11), confirming a bearish cascade on the intraday scale. The 1H RSI at 37.35 mirrors daily oversold conditions while the MACD line (-1.15) and signal (-1.16) hover nearly equal, producing a neutral histogram (+0.01). This reflects a temporary equilibrium without buying momentum.
Intraday Bollinger Bands and Resistance Levels
The 1H Bollinger Bands confine price between the midline ($125.99) and lower band ($123.79), with the upper band at $128.18 acting as immediate resistance. This scenario reinforces the bearish daily bias with no sign of reversal in sight.
Shorter-Term Technical Fluctuations Do Not Alter Trend
On the 15-minute chart, RSI improves slightly to 44.83, suggesting brief intraday stabilization. However, the 15m MACD histogram turned negative (-0.10), indicating momentum has shifted back downward amid this minor recovery. The EMA alignment (EMA20 at $125.28, EMA50 at $125.98, EMA200 at $127.41) remains bearish. Thus, the 15m chart displays only temporary noise within a clear downtrend, lacking any strong counterpoint to the dominant trend.
Fundamental Challenges Deepen Pressure on Lululemon Stock
Fundamentally, Lululemon’s Q1 2026 earnings showed modest top-line growth but lowered fiscal outlook. Management highlighted weaker sales trends, negative media and brand sentiment, and underperforming product launches. North American traffic is slowing while the brand contends with backlash amid a leadership vacuum as a new CEO has not yet taken charge.
International markets, particularly China, display some growth but do not offset domestic challenges. These factors compound technical weakness and heighten downside risks.
Key Trading Scenarios for Lululemon Stock
Bullish Scenario Requires Strong Rebound Above Key Levels
A bullish recovery depends on sustained closing above the daily pivot at $125.86 and a convincing move beyond resistance R1 at $128.06. Positive catalysts such as a credible CEO appointment, improved brand momentum, or sector rotation into consumer discretionary stocks could spark a short-covering rally. The daily MACD histogram improvement is the only technical element supporting a potential relief bounce, though it remains a fragile indication.
Bearish Scenario Capable of Extending the Selloff
Failure to hold the $122.73 support level could open a path to the lower Bollinger Band at $117.62. Given the ATR of $4.68, this decline might occur rapidly over two to three sessions if selling intensifies. Analyst downgrades following earnings, coupled with guidance cuts and deteriorating sentiment amid leadership uncertainty, increase downside risks substantially.
Conclusion: Lululemon Stock Bears Remain in Control
LULU exhibits a textbook bearish configuration across daily, hourly, and 15-minute charts. Elevated volatility, weakening fundamentals, and an absence of clear support point to further downside risks. Traders should treat short-term bounces cautiously and consider them as opportunities for short exposure, unless shares decisively reclaim levels above $128. The environment favors respecting the dominant downtrend amid ongoing uncertainty.