




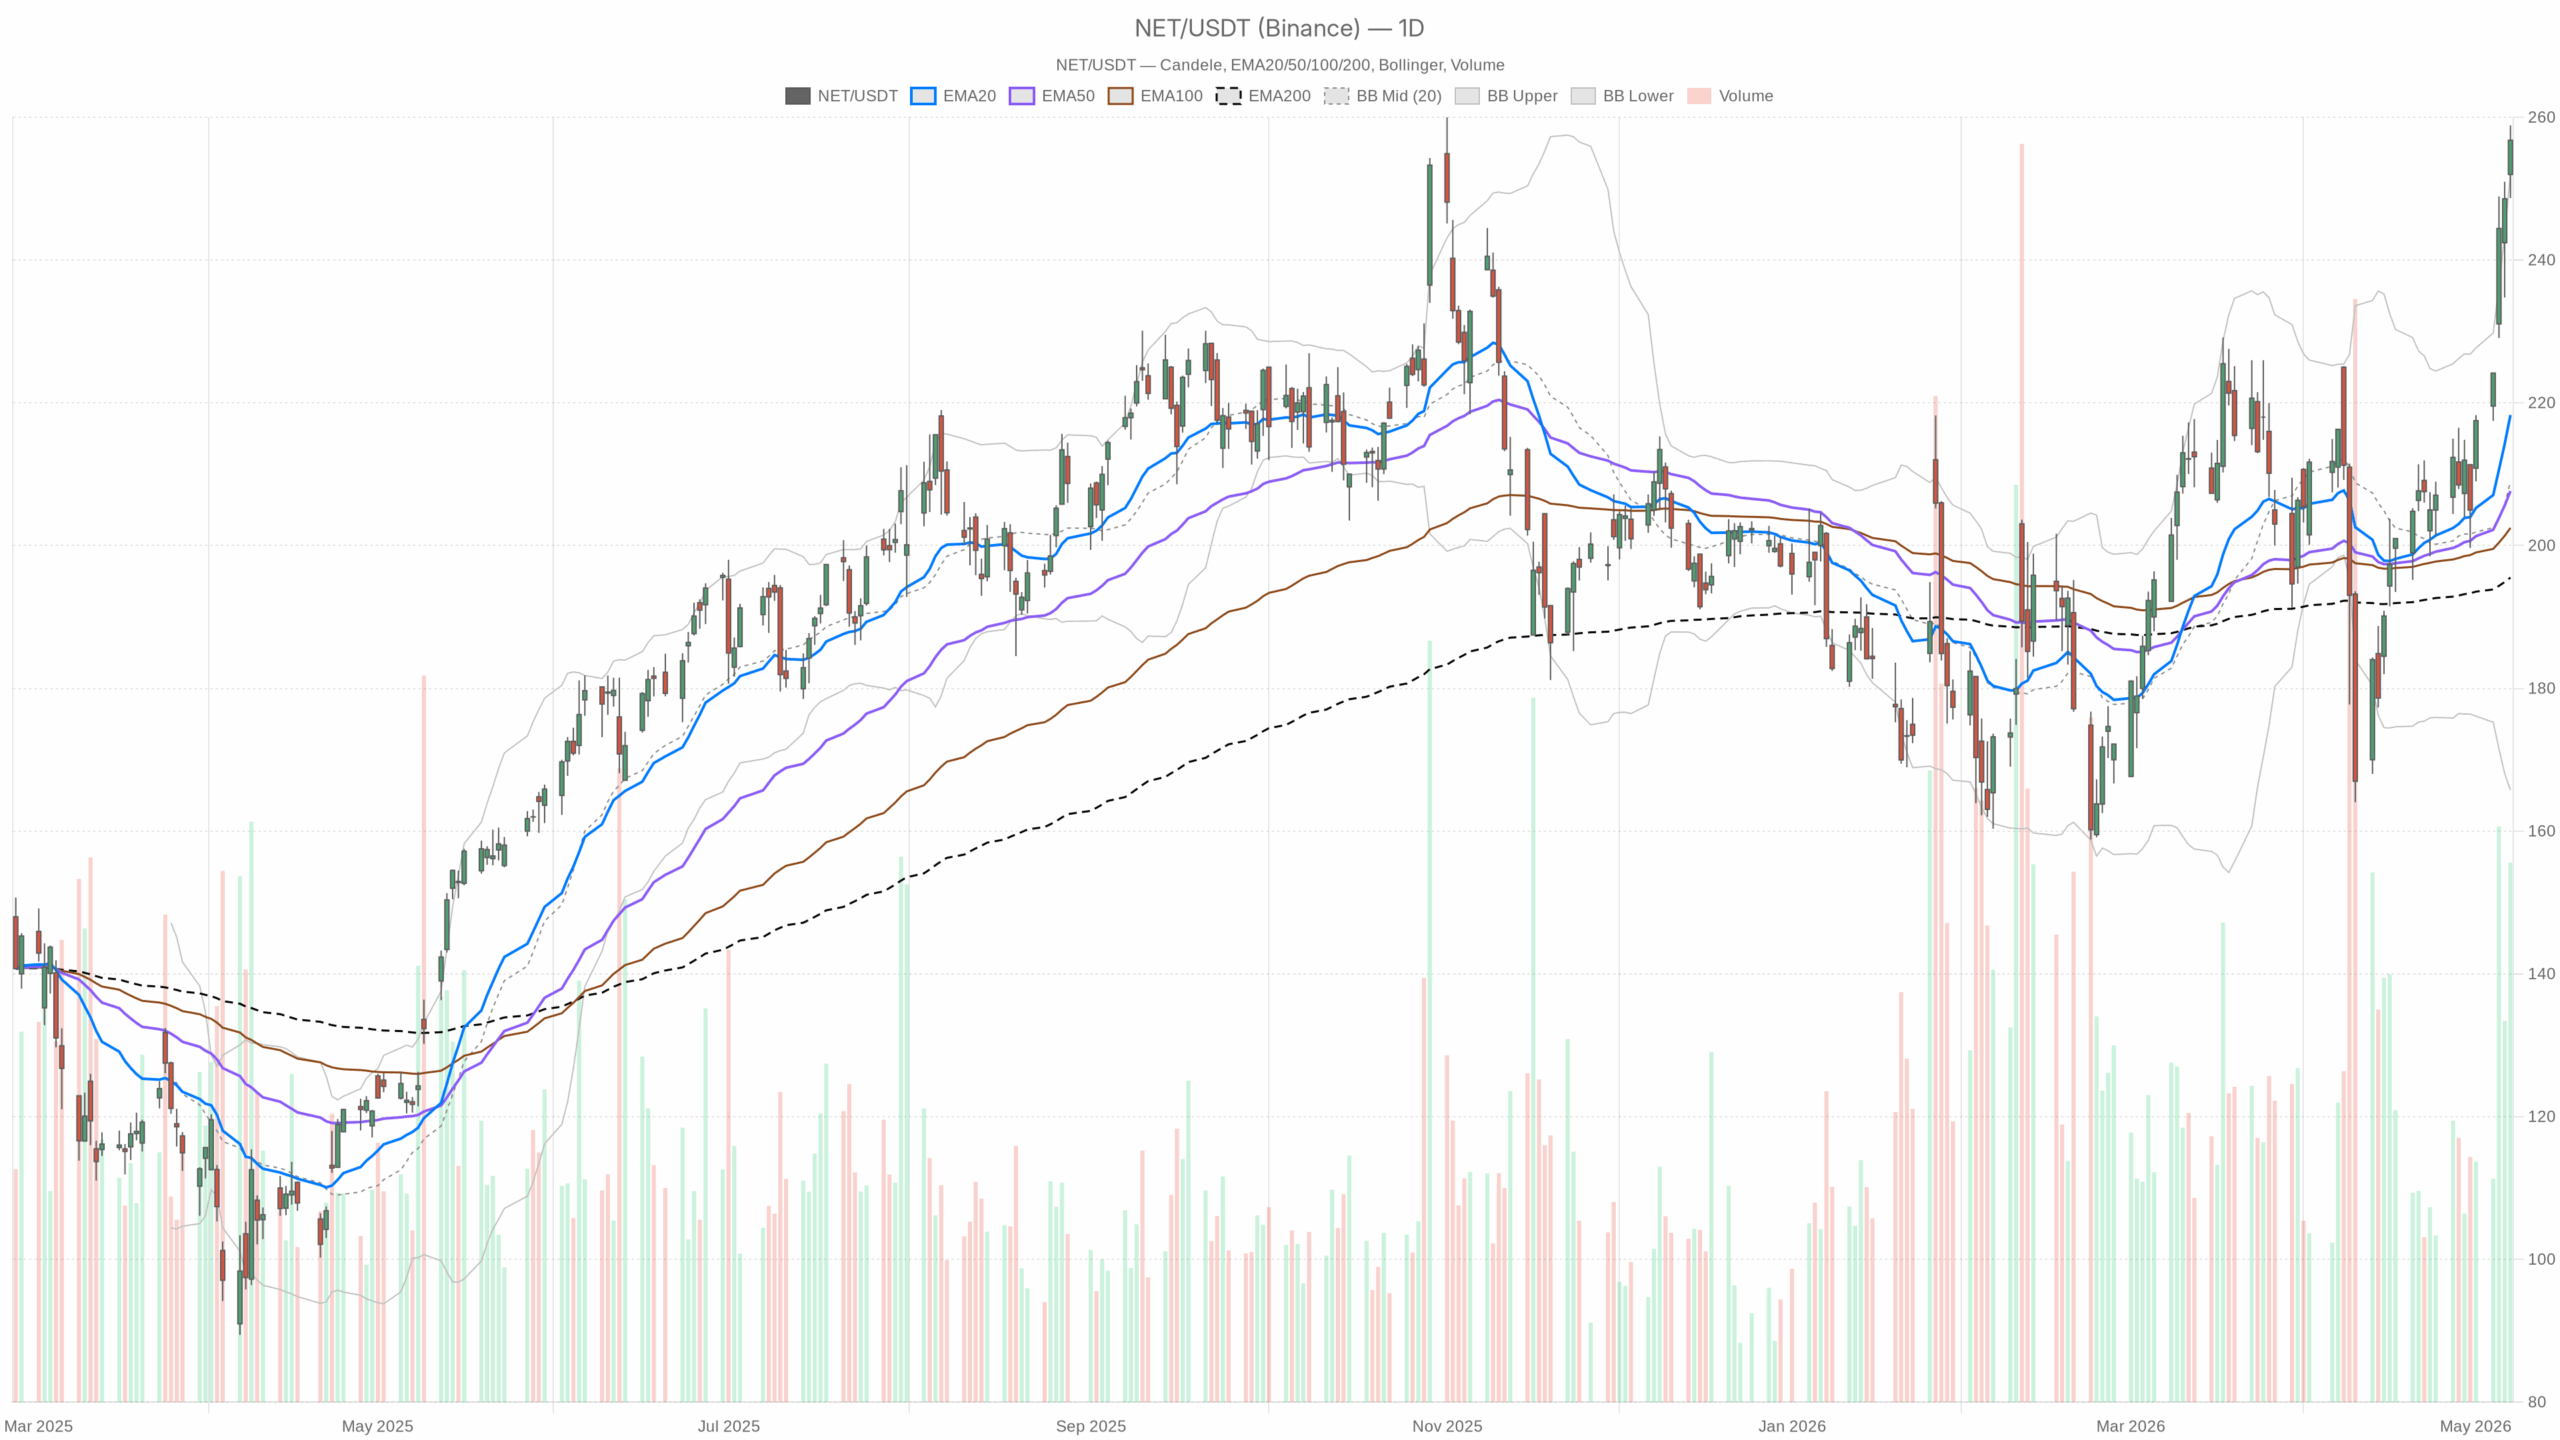
Cloudflare stock remains in a bullish daily trend, but that strength now faces a tougher post-earnings backdrop. NET closed at 256.79 on May 7, holding well above major moving averages. However, soft Q2 guidance and deep job cuts tied to its AI-first shift have complicated the setup.
Summary
Cloudflare Stock still holds a bullish daily trend
Therefore, the main scenario remains bullish on the daily timeframe. Still, it is a vulnerable bullish trend rather than a clean momentum continuation. Price is stretched, sentiment has been hit by the soft outlook, and shorter-term momentum already shows signs of tiring near resistance.
On the daily chart, the trend backdrop is still strong. NET is trading above the 20-day EMA at 218.3, the 50-day EMA at 207.63, and the 200-day EMA at 195.52. That alignment confirms a well-established uptrend. It also shows that buyers still control the broader structure.
At the same time, the distance from those averages is wide. That implies Cloudflare stock is extended and more exposed to sharp mean reversion if buying pressure fades.
Momentum stays constructive, but overbought conditions matter
Daily momentum is still strong, but it is no longer comfortable. The RSI stands at 72.44, putting Cloudflare stock in overbought territory. That reflects powerful upside momentum. However, it also warns that the move has become crowded and may struggle to absorb negative catalysts smoothly.
Meanwhile, MACD remains constructive, with the line at 11.01 above the signal at 5.48 and a positive histogram of 5.52. That still supports the broader bullish trend. It also indicates that upward momentum has not fully broken on the higher timeframe.
Notably, price closed above the daily upper Bollinger Band at 252.23, with the stock finishing at 256.79. That shows a strong upside expansion. Yet it also signals that the move is trading outside its recent volatility envelope. In practice, that often happens during powerful breakouts. Still, it can also mark the point where momentum becomes harder to sustain without fresh demand.
Resistance and volatility define the near-term test
Volatility is elevated but manageable on the daily chart. ATR sits at 10.91, which is a meaningful daily range for a stock at this level. Therefore, traders should expect larger swings than usual as earnings and restructuring headlines are digested.
Daily pivot levels reinforce how tightly price is trading against resistance. The pivot sits at 254.79, support is at 250.7, and first resistance is at 260.88. Holding above the pivot keeps the immediate tone constructive. However, repeated failure under 260.88 would signal that the rally is running into supply.
Cloudflare Stock on the hourly chart shows fading thrust
However, the one-hour chart weakens the clean bullish case rather than confirming it. Price remains above the 20-hour EMA at 246.91, the 50-hour EMA at 233.36, and the 200-hour EMA at 213.92. That still reflects an intact short-term uptrend. At the same time, the market has not fully rolled over.
Momentum, though, is no longer improving. The hourly RSI is 76.88, which is deeply stretched. Meanwhile, MACD has turned less supportive, with the line at 7.84 just below the signal at 8.21 and a slightly negative histogram of -0.37. That combination points to fading upside thrust even as price remains elevated.
Hourly resistance remains a tactical decision zone
The hourly Bollinger structure sends a similar message. NET closed at 257.05 versus an upper band at 258.47, so price is pressing the top of its recent range without decisively breaking away. That implies buyers are still active. However, follow-through is becoming less efficient.
Hourly ATR at 4.16 also suggests intraday swings remain large enough for sharp reversals. Pivot levels place the market just above the pivot at 256.4 and below R1 at 258.82. In other words, Cloudflare stock is sitting in a narrow tactical zone. A push through resistance could extend the move. On the other hand, rejection there would fit the momentum slowdown.
Intraday Cloudflare stock action stays positive but softer
Meanwhile, the 15-minute chart is best read as execution context rather than a change in trend. Price is still above the 20-period EMA at 253.91, the 50-period EMA at 250.04, and the 200-period EMA at 231.9. So, the micro structure remains positive.
Yet the shorter momentum picture is softer than the trend structure. RSI is 65.61, which is firm but less extreme. At the same time, MACD is slightly negative, with the line at 1.31 under the signal at 1.38. That implies short-term buyers are still present, but immediate momentum has cooled after the latest push.
The 15-minute Bollinger Bands add to that view. Price at 257.05 is above the upper band at 256.59, showing short-term extension. That often supports breakout attempts. Still, it also increases the chance of brief pullbacks toward the mean.
ATR at 2.05 suggests fast but relatively contained intraday movement. Pivot levels at 256.78, with resistance at 258.44 and support at 255.38, show that execution risk is concentrated in a very tight area. Above that band of resistance, buyers regain control. Below it, momentum can quickly flatten.
Cloudflare Stock outlook: bullish trend, weaker momentum
The core conflict is clear. The daily chart still argues that Cloudflare stock is in a strong primary uptrend. In contrast, the one-hour and 15-minute charts show that upside momentum is tiring as the company faces negative post-earnings headlines. That does not erase the bigger bullish structure. It does, however, raise the probability of volatility, failed breakouts, or a pullback before any sustained advance resumes.
Bullish scenario
From a bullish perspective, the key argument is that the market absorbs the weak guidance and restructuring news without losing the daily trend. If NET can continue to hold above the daily pivot near 254.79 and then clear resistance in the 258.8 to 260.9 area, the broader uptrend would remain in command.
In that case, the stretched momentum readings would be treated as trend strength rather than exhaustion. Buyers would show they are willing to pay through negative headlines.
Bearish scenario
On the other hand, the bearish scenario is becoming more credible because the catalyst risk is now fundamental, not just technical. If the stock fails to hold the 254.8 to 250.7 zone and shorter-term MACD weakness deepens, the market could start unwinding its overbought daily condition.
That would invalidate the immediate bullish continuation case and shift focus toward mean reversion. Notably, that risk matters more after a move that already sits far above the 20-day EMA.
Overall view on Cloudflare stock
Overall, Cloudflare stock remains bullish on the daily chart, but the trend is under pressure from a poor reaction to otherwise solid earnings. The higher timeframe still favors buyers. However, the hourly and intraday signals warn that momentum is losing quality near resistance. Positioning now hinges on whether NET can stabilize above pivot support and absorb the negative news flow, because volatility is elevated and conviction is no longer one-sided.
