

Verizon stock is facing significant selling pressure, with technical and fundamental signals pointing to further weakness. The stock closed at $44.87 on June 4, 2026, sharply down from its earlier high, indicating a sustained bearish phase.
Summary
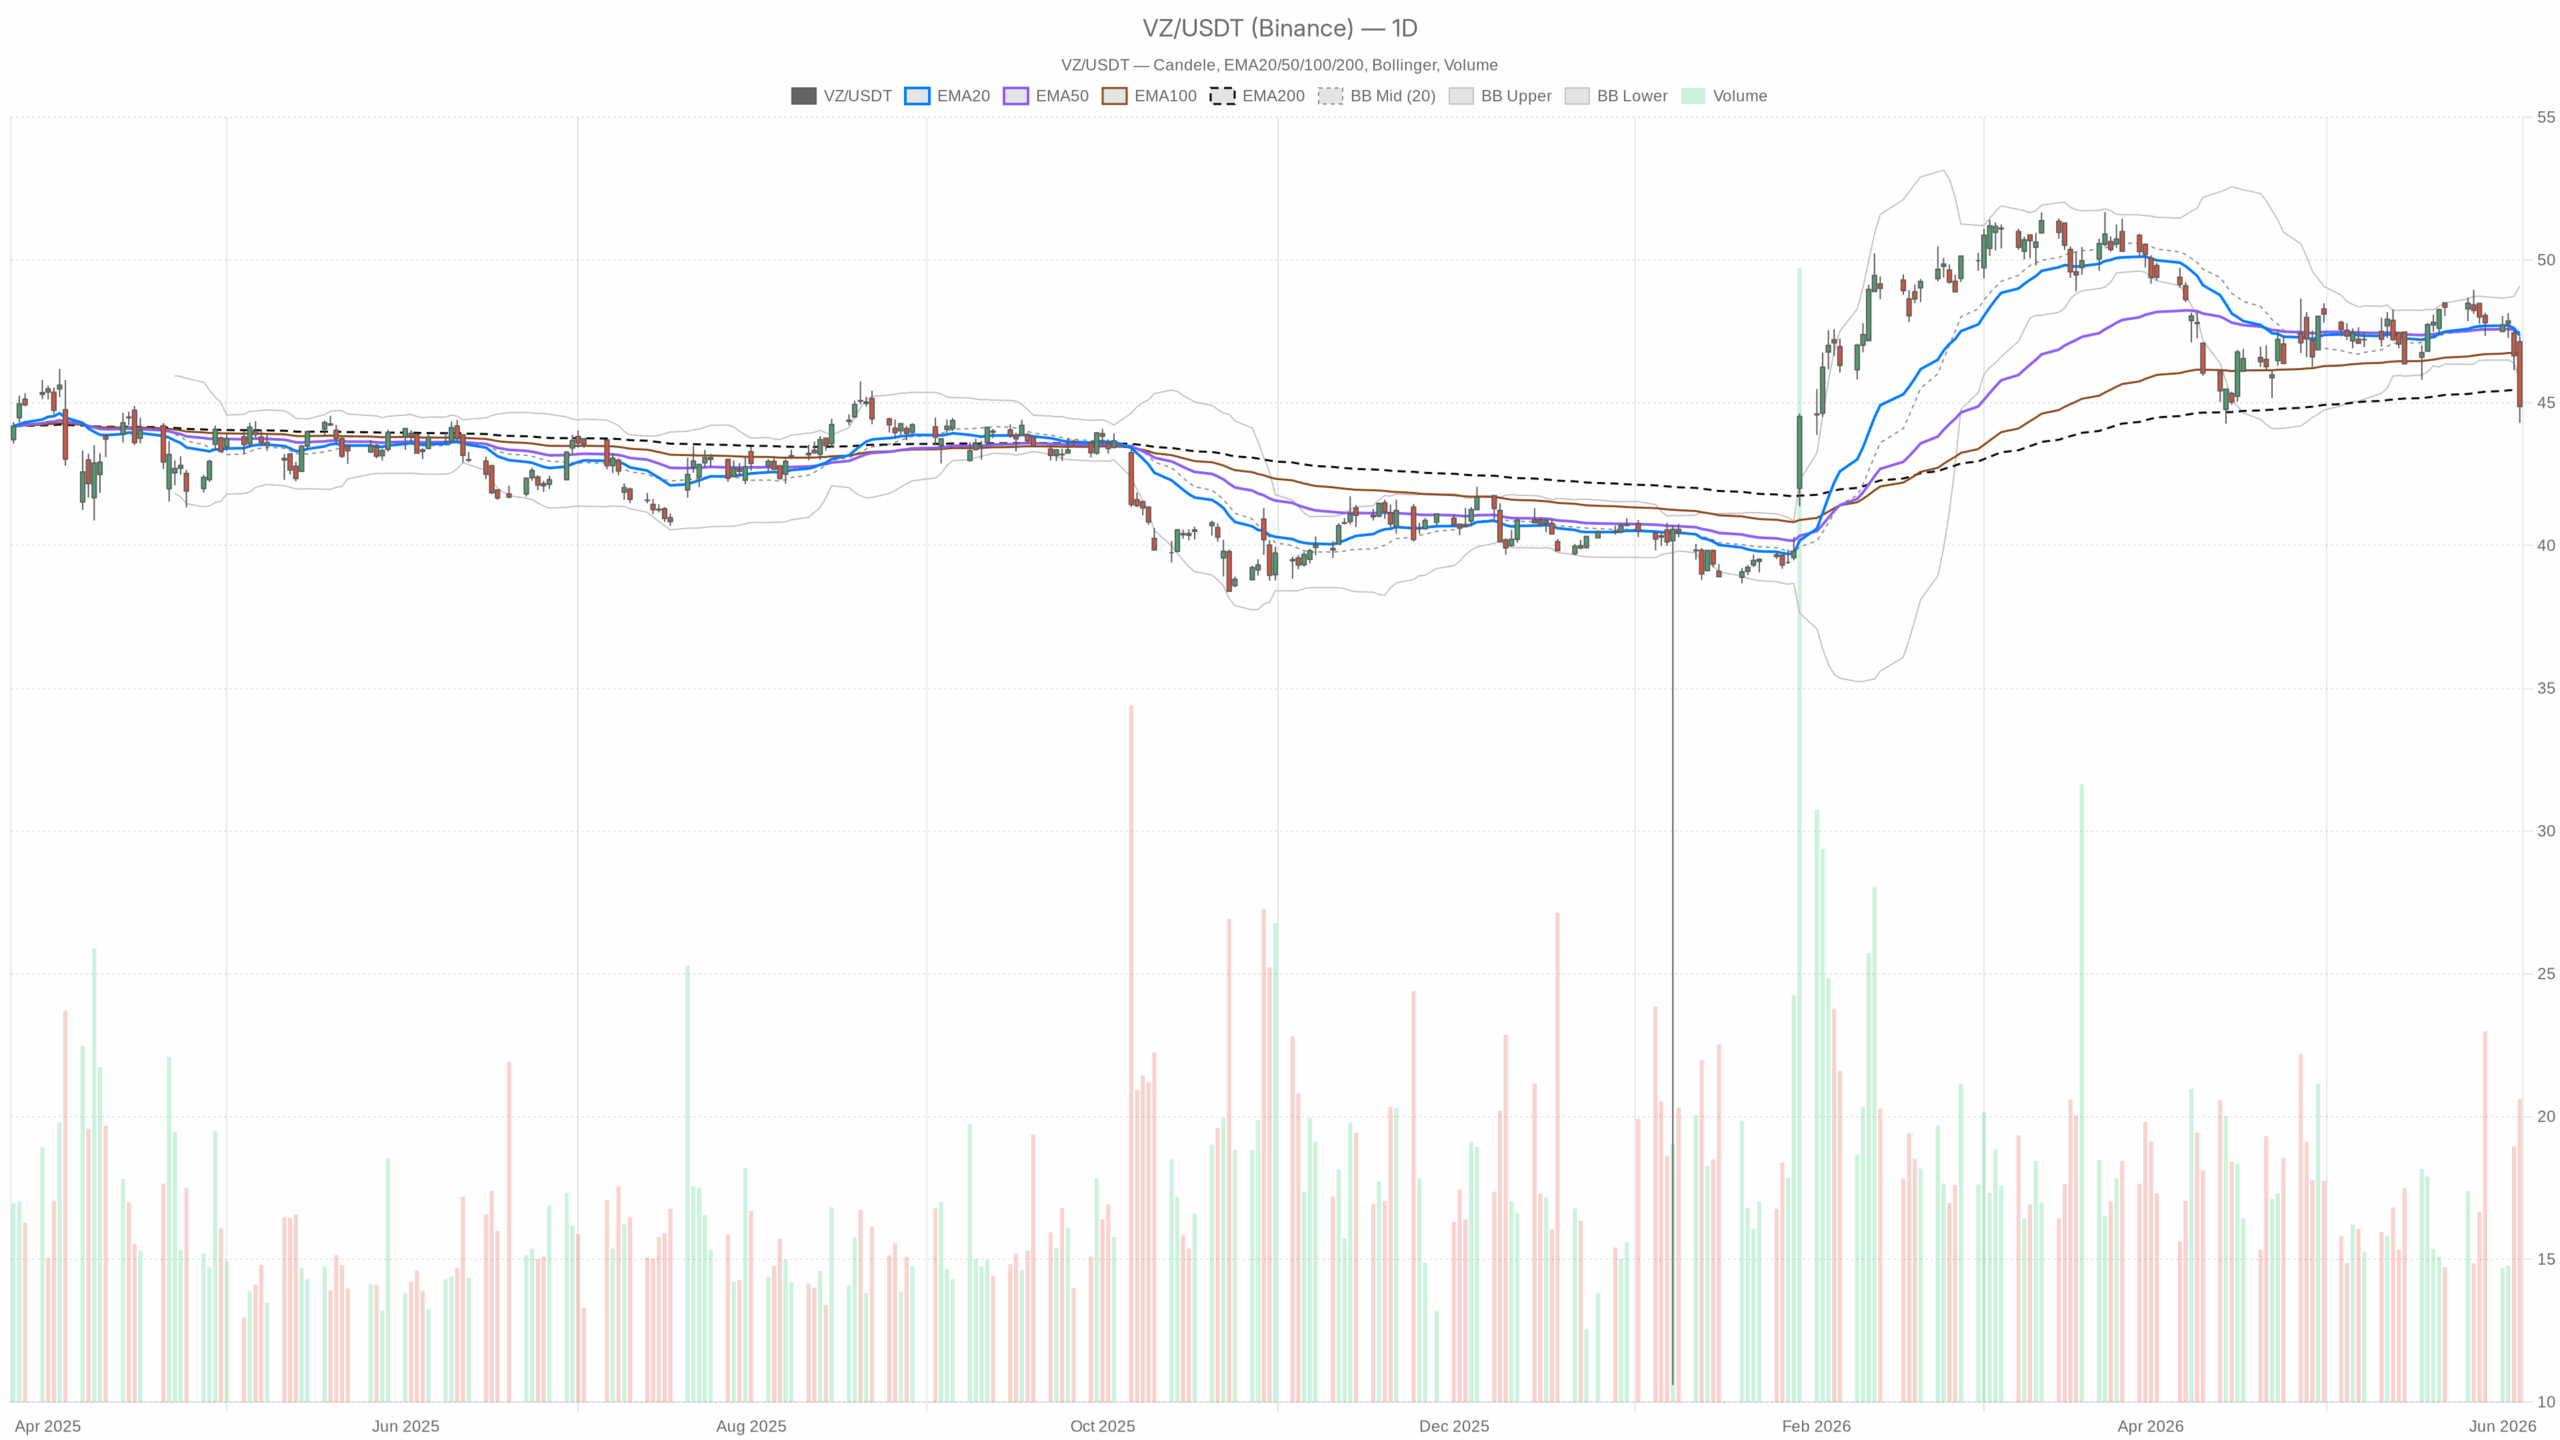
Daily Timeframe: Breakdown Beneath Key Moving Averages
On the daily chart, Verizon stock closed well below its EMA20 at $47.35 and EMA50 at $47.45, signaling a strong bearish alignment. The price has also dropped beneath the Bollinger Band midline and critically below its lower band at $45.78, which indicates a genuine momentum shift rather than routine fluctuations.
Additionally, the stock broke below the longer-term EMA200 at $45.44, marking a deterioration in its technical foundation. For a yield-focused telecom stock, trading below this average is a significant bearish signal.
The daily RSI is near oversold at 30.56, which may attract short-term buyers, but in a downtrend, this often reflects sustained institutional selling. The MACD also confirms accelerating bearish momentum with a negative histogram, while the ATR at 1.05 highlights elevated volatility, making $1 intraday moves common.
Daily pivot points place resistance at $46.70 and support at $43.67, with the current close below the pivot at $45.50, indicating structural weakness.
Hourly Timeframe: Bearish Momentum Remains Unabated
The hourly chart reinforces the negative outlook. Verizon stock trades below all major moving averages on this timeframe — EMA20 at $46.20, EMA50 at $47.02, and EMA200 at $47.47 — all far above the current price.
The hourly RSI sits deep in oversold territory at 26.7. Such readings can trigger short-covering or dip buying but often signal aggressive selling pressure when no catalyst is present. The hourly MACD remains firmly bearish as well, with no sign of momentum easing.
Price hugs the lower Bollinger Band boundary at $44.33, corroborating oversold conditions. The 1H ATR at $0.56 indicates moderate volatility, sufficient for swings but not extreme spikes.
15-Minute Timeframe: Signs of Micro Stabilization but Vulnerable
At the 15-minute level, a slight positive MACD histogram reading suggests short-term selling exhaustion, but this signal is fragile within the broader downtrend. The stock rests near its Bollinger Band lower boundary of $44.32, with the EMA200 at $47.11 highlighting how far price has dropped from recent averages.
The RSI at 35.13 shows some relief from oversold but no clear recovery. A break below the 15-minute support at $44.75 would open the path toward daily support around $43.67, underscoring vulnerability.
Fundamental Backdrop: Operational Issues Add to Technical Weakness
Recent unfavorable news compounds Verizon’s technical challenges. CEO Dan Schulman’s comments on AI-driven customer service reductions raise uncertainty about workforce strategy and execution risks. Although cost savings could benefit long-term fundamentals, short-term disruption clouds sentiment.
Employee resistance to sales policy changes and reports of customer experience issues further undermine confidence. Additionally, concerns about Starlink competition and valuation gaps from a Wall Street brokerage add pressure. While not existential threats, these factors align coherently with the technical breakdown.
Bullish Scenario: Conditions for Recovery
For Verizon stock to regain strength, it must first close above the daily pivot at $45.50, then overcome resistance at $46.70. A sustained move beyond $47.00, where key daily EMAs cluster, would indicate absorption of selling pressure.
This recovery would need confirmation from narrowing daily MACD histograms and a rising hourly RSI above 40. Positive operational metrics, such as reduced customer churn and improved store performance, could support a bullish turn. Additionally, the rising dividend yield at lower prices might attract income-oriented investors to provide a solid floor.
Bearish Scenario: Signals of Further Decline
The downside case strengthens if Verizon fails to hold the $44.75-$44.33 support zone found in both 15-minute and hourly Bollinger Bands. A sustained breakdown below $44.30 would target daily support near $43.67, with increased uncertainty beyond that level.
Ongoing negative operational news, heightened competitive pressures from Starlink, or earnings revisions would intensify bearish momentum. With MACD still negative and price below key EMAs, the downtrend with lower highs and lows remains intact.
Positioning and Outlook for Verizon Stock
Verizon stock enters the next session in a compromised technical position. The daily bias is bearish, the hourly chart confirms ongoing selling, and even though oversold readings suggest a possible short-term bounce, they do not guarantee reversal. Real buying conviction is necessary to change this outlook.
Volatility remains elevated, and fundamental uncertainties persist amid an inverted moving average structure. Traders should focus on the $44.75 level as a key battleground. Upcoming price action near this support will be critical in determining whether bears maintain control or bulls can mount a comeback.