

UiPath stock closed at $10.65 on June 11, trading below its 200-day EMA at $12.15 and beneath converging 20- and 50-day EMAs near $11.10. The daily regime is neutral, yet context leans bearish. Improving fundamentals have not yet translated into chart strength.
Summary
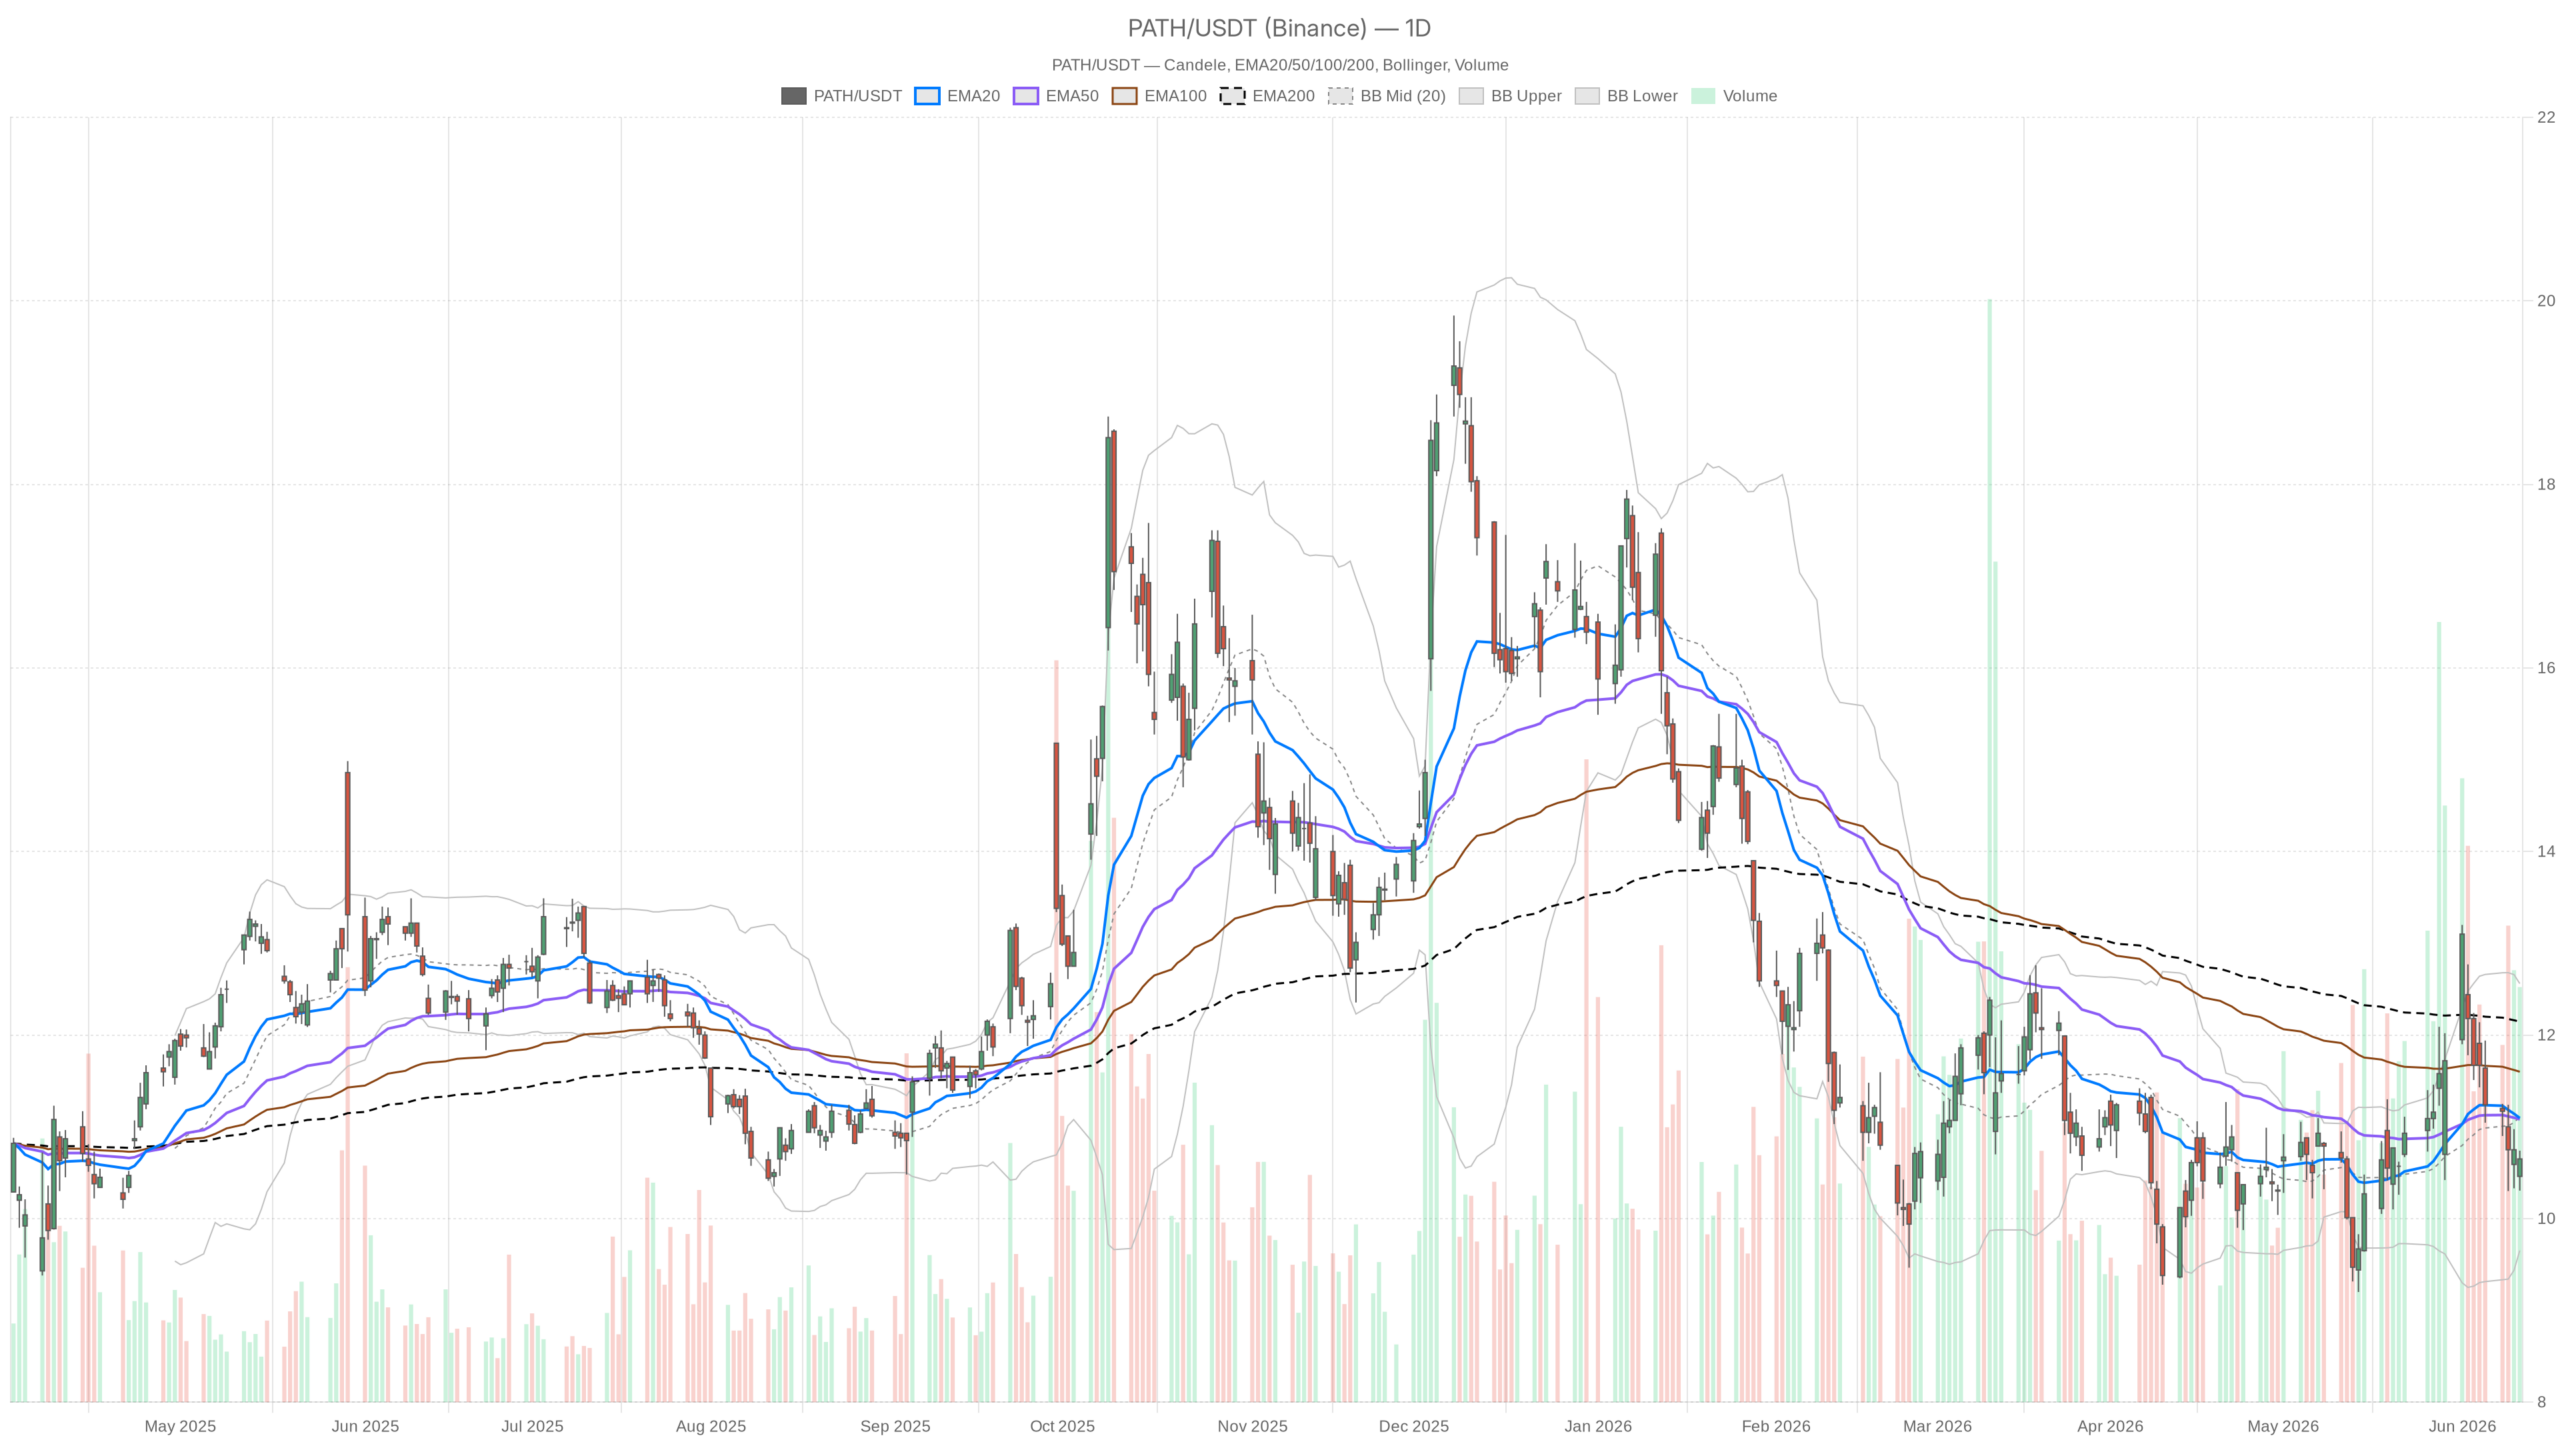
PATH Daily Structure: Pressure Remains Overhead
On the daily timeframe, PATH’s EMA stack tells a clear story. The 20-day EMA at $11.10 and the 50-day EMA at $11.08 are nearly flat and converging, suggesting the trend has stalled rather than reversed. The 200-day EMA at $12.15 sits roughly 14% above the current price. This is a significant structural overhang that limits upside momentum in the near term.
Meanwhile, the daily RSI reads 45.16. That places PATH in a mild bearish zone — not oversold, not recovering with any real energy. The MACD reinforces this reading. The histogram prints at -0.11, with the MACD line at 0.09 running below the signal line at 0.20. There is no bullish crossover in sight at the daily level.
Bollinger Bands on the daily chart place the midline at $11.11, with the lower band at $9.65 and the upper at $12.56. Price is trading below the midline. In Bollinger terms, this means the stock sits in the lower half of its recent range — consistent with a market that lacks buying conviction. The ATR of $0.84 reflects meaningful daily volatility, roughly 8% of price, meaning swings can be sharp in either direction.
Daily pivot levels show the pivot point at $10.56, R1 at $10.82, and S1 at $10.39. PATH closed at $10.65, placing it above its pivot point but still below R1. That narrow range between support and resistance signals a market in wait-and-see mode.
Hourly View: PATH Stabilizes with Weak Momentum
The 1-hour timeframe does not contradict the daily bias — it reinforces it with some nuance. The hourly EMA structure shows the 20-EMA at $10.76 and the 50-EMA at $11.03, both above the current price. Meanwhile, the 200-EMA on the hourly sits at $10.95. Price closed the last hourly session at $10.66, below all three averages. That alignment confirms short-term bearish pressure.
However, the hourly MACD histogram has turned slightly positive at +0.02, even as the MACD line remains deeply negative at -0.14. This is a tentative early signal — not a reversal, but a deceleration in selling. The hourly RSI at 42.13 remains below the 50 midpoint, consistent with a market that is stabilizing rather than recovering.
Hourly Bollinger Bands are tighter: upper at $10.92, lower at $10.44, mid at $10.68. Price is hugging the midline from below. The hourly ATR of $0.19 indicates relatively contained intraday swings. The hourly pivot sits at $10.66, with R1 at $10.73 and S1 at $10.59. This extremely compressed range reflects indecision in real time.
15-Minute Context: A Minor Uptick, No Trend
At the 15-minute level, the picture is marginally more constructive. The RSI sits at 51.47 — just above neutral — and the MACD histogram is a thin positive at +0.01. The 20-EMA at $10.64 and 50-EMA at $10.68 are both below price, giving the shortest timeframe a slight bullish tilt. Still, the 200-EMA on the 15m at $11.07 remains a distant ceiling.
This near-term micro-uptick should not be read as a trend shift. It is execution context — useful for identifying entry timing on a longer-term thesis, but not a signal on its own.
UiPath Stock Fundamental Backdrop: Real Progress, Uncertain Positioning
The fundamental narrative around PATH has improved. The company is pivoting toward AI-driven agentic automation, launching platforms like “UiPath for Coding Agents” and securing cybersecurity certifications in new markets such as the UAE. Revenue and ARR are accelerating. Profit margins are expanding meaningfully.
Nevertheless, competitive pressure from larger enterprise software players remains a genuine risk. Analysts at Barclays maintained a Hold with a $14 price target — implying roughly 33% upside from current levels. That gap between analyst targets and the actual price reflects market uncertainty. The open question is whether UiPath can establish clear agentic AI leadership before competitors close the gap.
PATH Bullish Scenario
A bullish case for PATH requires reclaiming the $11.08–$11.10 EMA zone on the daily chart. A clean close above that level would signal that the trend is shifting. From there, the next meaningful target would be the daily R1 cluster and eventually the Bollinger midline at $11.11. If momentum builds, the $12.15 area — the 200-day EMA — becomes a realistic medium-term target, broadly in line with the analyst price objective.
Supporting factors for this scenario include continued margin expansion, stronger-than-expected ARR growth, and any evidence that UiPath is gaining traction in the agentic AI space. A broader risk-on environment in mid-cap technology would also help.
PATH Bearish Scenario
On the other hand, if PATH fails to reclaim $11.00 and breaks below the daily S1 at $10.39, the next meaningful support sits near the lower Bollinger Band at $9.65. That level would represent a significant erosion of recent stabilization. A sustained break below $10.00 would call the entire recovery thesis into question.
The bearish case finds support in two technical factors. The daily MACD histogram remains negative, and the RSI has not yet shown meaningful bullish divergence. If competitive pressure in enterprise AI intensifies and UiPath fails to differentiate its agentic offering, the stock could remain range-bound or drift lower despite improving margins.
PATH Positioning and Volatility Outlook
Overall, PATH sits at a structural crossroads. The stock is not technically broken — it is holding above daily support — but it has not yet found the momentum to challenge its overhead moving averages. With ATR elevated at the daily level, volatility risk is real in both directions. Traders looking for near-term entries would need to see the $11.00 level reclaimed convincingly before extending exposure. Until that happens, the path of least resistance remains sideways to modestly lower. The fundamental improvement is genuine, but the chart has not yet confirmed it.