

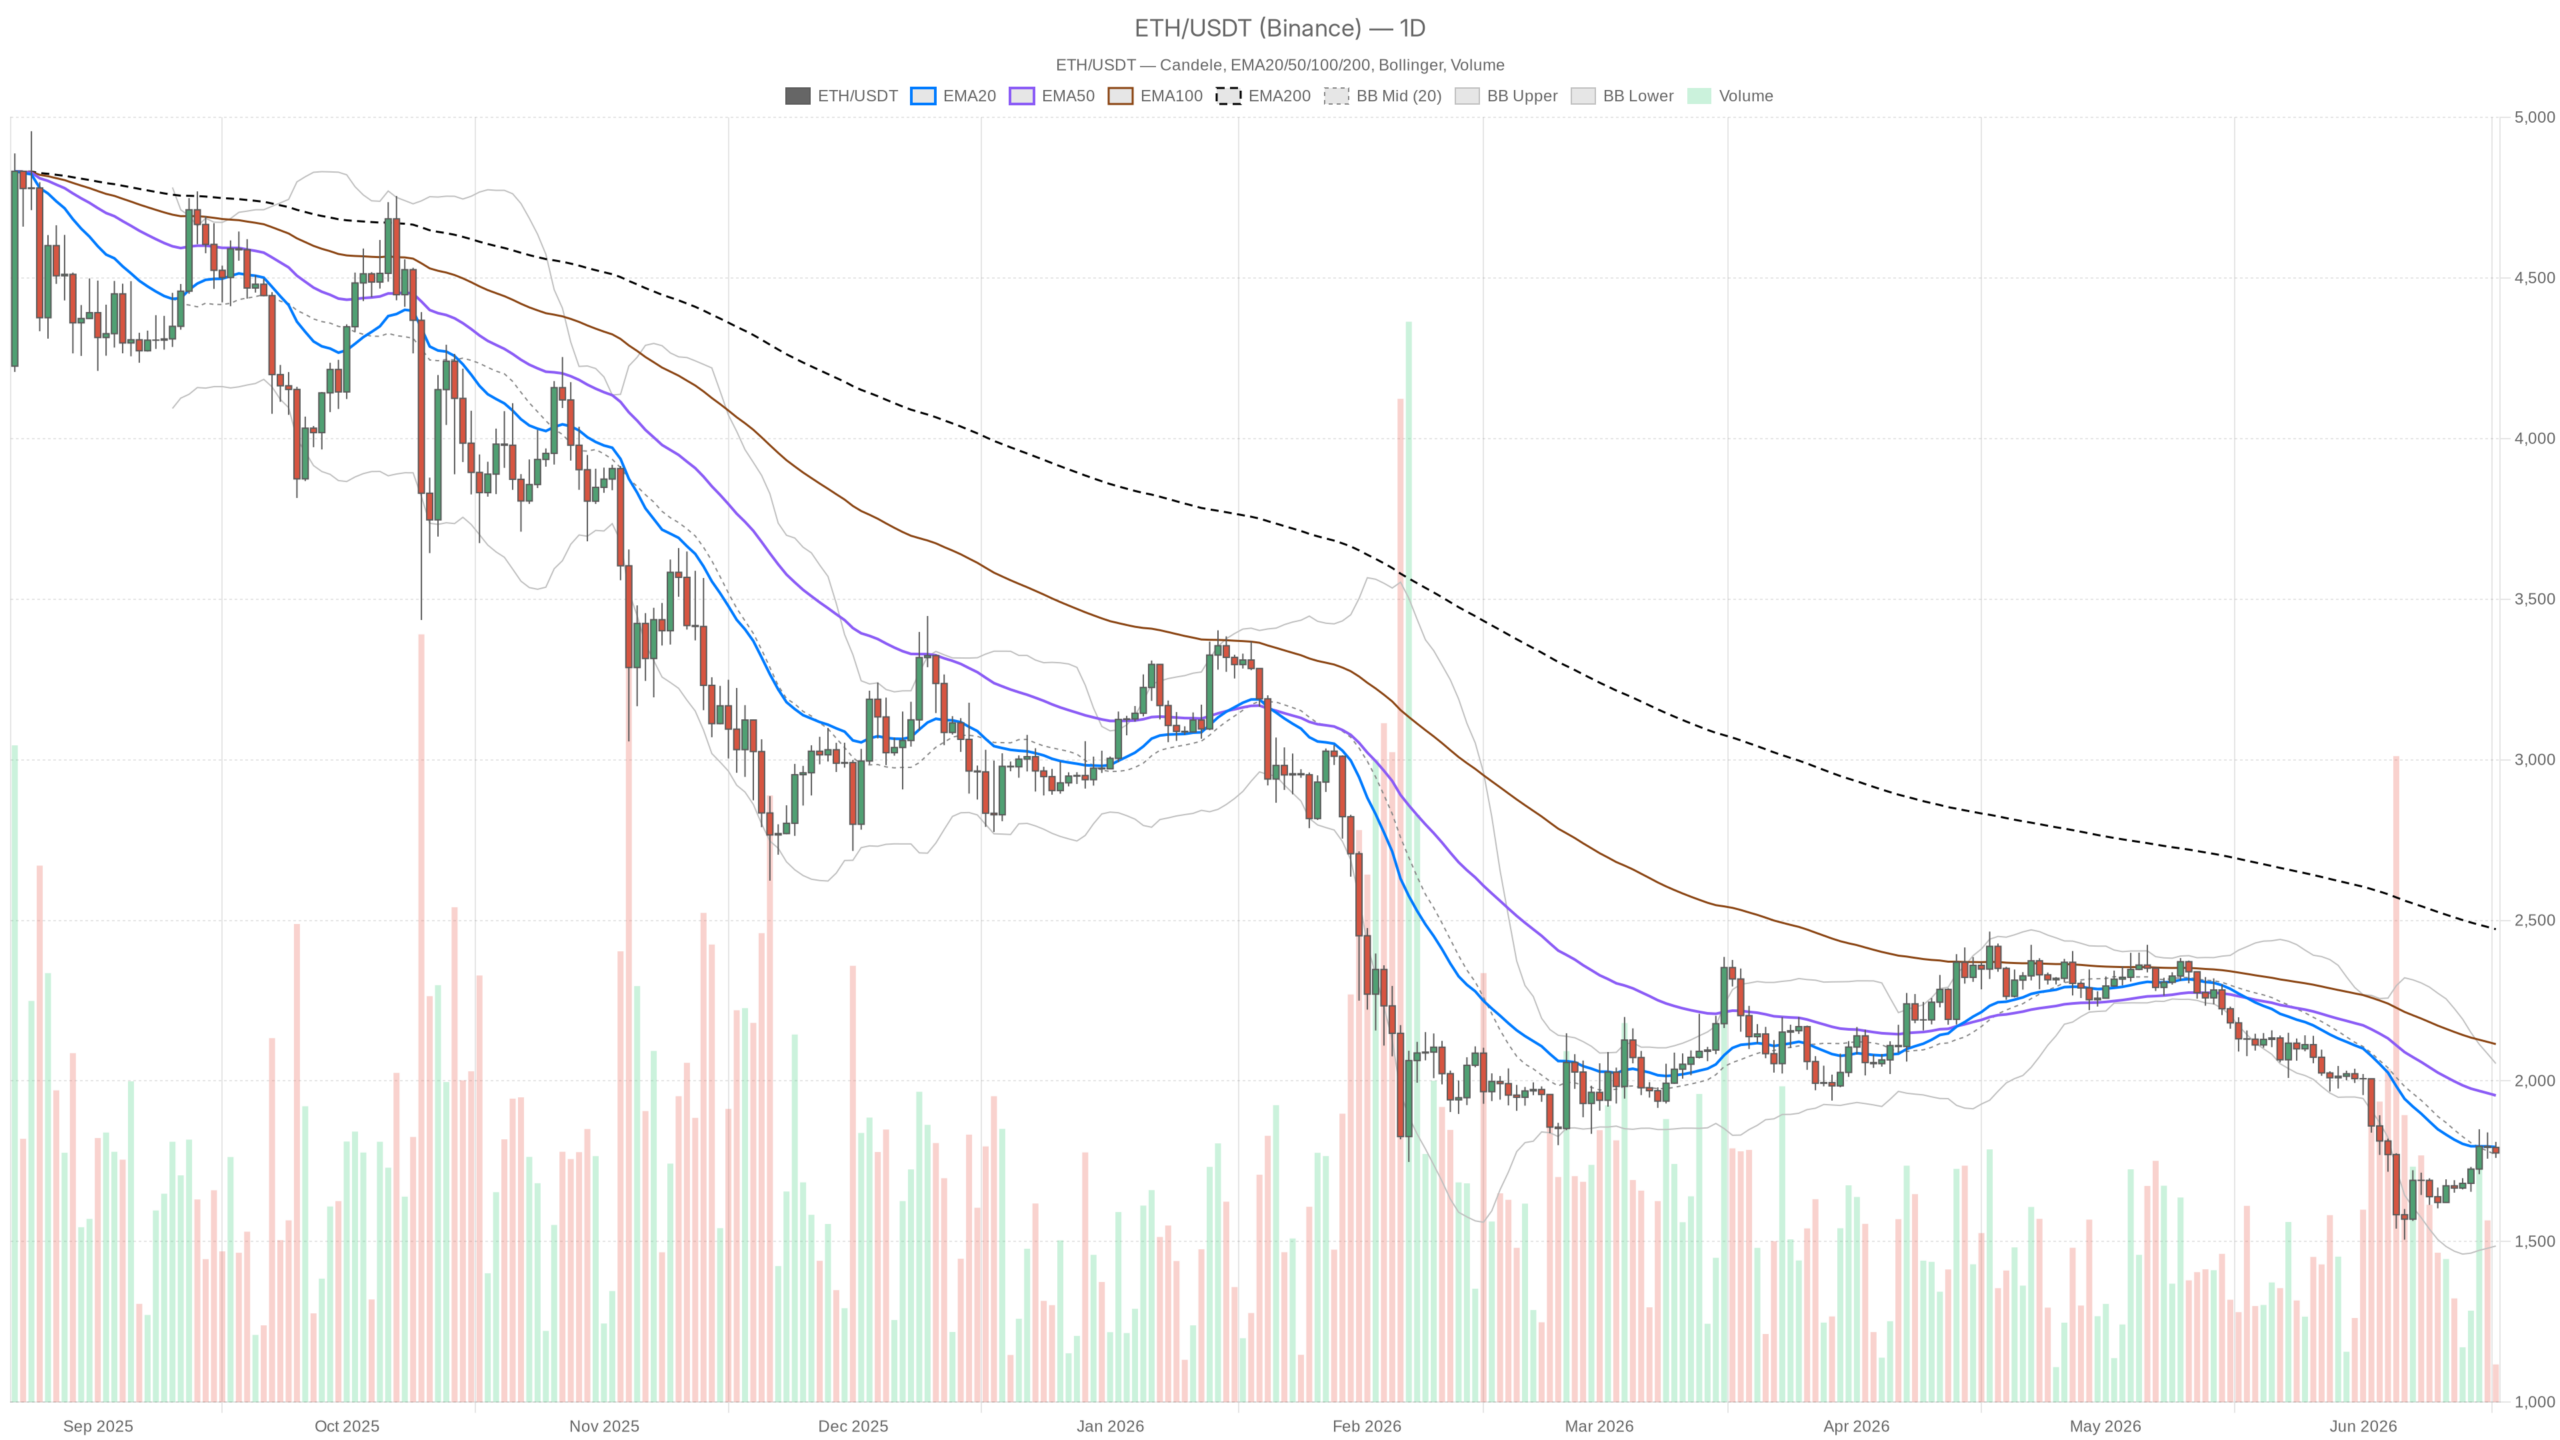
As of June 17, 2026, the Ethereum price stands at 1,775 dollars, in a phase that leaves no room for enthusiasm. The bearish pressure on the daily chart remains unresolved, while the lower timeframes show timid signs of stabilization. Those looking for clear signals risk finding what they want to see.
Summary
Key points
- ETH is trading at $1,775 in a structurally bearish regime on the daily, with the main moving averages above the price.
- The daily RSI14 at 43.49 indicates weak momentum but no ongoing capitulation.
- The pivot support S1 at $1,753 is the critical level to monitor in the short term.
- BTC dominance at 56.2% and the Fear & Greed Index at 22 are penalizing altcoins, including Ethereum.
- DeFi activity shows mixed signals: Uniswap V3 has recorded a +94% increase in 30-day fees.
The underlying picture is clear: Ethereum is in a structurally bearish regime on the daily. This is not a pessimistic reading; it is what the moving averages are signaling. The EMA20 at $1,794 is already above the price, and this in itself describes short-term weakness. But the most telling data is the EMA50 at $1,954 and especially the EMA200 at $2,472.
ETH is trading at a significant discount compared to its long-term average. This indicates that the market has not yet absorbed the damage from the downward trend of recent months. The price is compressed below levels that, under normal conditions, should have acted as dynamic support.
The RSI14 on the daily is at 43.49, in negative territory but far from the area of extreme oversold. There is no capitulation underway, nor a technical rebound from exhaustion of selling. It is a gray area: the market is not depressed enough to justify a sentiment reversal, but it is not in free fall either. This type of RSI, stationary below 50 for weeks, often accompanies orderly bearish trends in which every rebound is sold with discipline.
The daily MACD tells the same story in a more nuanced way. The MACD line is at -85.3 with the signal at -112.05 and the histogram positive at +26.75. The growing histogram indicates that the divergence between the two lines is shrinking: the bearish momentum is losing strength. However, a MACD rising from deeply negative values can take weeks before giving a real bullish crossover. Those trading on the back of this easing expose themselves to false signals.
The Bollinger Bands on the daily frame the price almost exactly on the middle band at $1,770, with the upper band at $2,054 and the lower one at $1,485. The width of the band, almost 570 points, signals significant volatility. ETH is not compressed in a tight range: there is room to move in both directions. In itself the data is neutral, but it becomes bearish when combined with the descending EMAs above the price.
The daily ATR14 at $93 is not negligible and represents the average daily volatility, requiring caution in risk management. Those trading ETH must factor in intraday swings of this magnitude. The pivot levels confirm the current equilibrium area: the price of $1,775 is between the pivot support S1 at $1,753 and the main pivot PP at $1,782. The resistance R1 at $1,803 is close, less than 30 points away. This explains why every rebound attempt struggles to gain traction.
Dropping down to the 1H, the regime becomes neutral and here a divergence emerges that must be read carefully. The EMA50 at $1,776 is practically aligned with the price and the EMA200 at $1,720 is well below: on an hourly scale ETH is not under immediate bearish pressure. However, the EMA20 at $1,787 is still pressing from above and the hourly RSI at 43.35 shows no strength. The MACD on the 1H has the histogram at -3.44, negative and worsening. The Bollinger Bands on the hour show a much narrower range, between $1,772 and $1,807: ETH is moving in the lower part of the hourly channel, without convincing either to the upside or the downside.
On the 15-minute chart the context is similar. The EMA20 and EMA50 are above the price, at $1,782 and $1,787 respectively, while the EMA200 at $1,776 is almost in contact. The MACD on this timeframe is negative with a histogram at -1.79, slightly worsening, and the RSI at 42.62 confirms the lack of bullish pressure in the short term. The micro-structure is undecided, reflecting a market waiting for a directional catalyst.
The macro market context, moreover, does not help. The total crypto market capitalization has lost -1.76% in the last 24 hours and Bitcoin dominates with 56.2%, according to CoinGecko data. This level of BTC dominance is generally unfavorable for altcoins, including Ethereum: when capital concentrates on Bitcoin, ETH struggles to perform independently. The Fear & Greed Index at 22 — Extreme Fear completes the picture. A fearful market does not buy, and buying in extreme fear requires solid technical evidence that is currently lacking.
It is worth noting that DeFi activity on Ethereum shows some mixed signals. According to DefiLlama data, Uniswap V3 has recorded a 94% increase in 30-day fees, a sign that network usage has not collapsed. However, this is not translating into buying pressure on the token: the macro sentiment prevails.
Bullish scenario
For ETH to build a credible bullish trajectory, it must first decisively reclaim the $1,800–$1,803 area, corresponding to the R1 pivot resistance and the daily EMA20. A daily close above this zone, accompanied by an RSI rising toward 50 and a MACD with an expanding positive histogram, would change the tactical picture. The next target would be the $1,950–$1,960 area, where the daily EMA50 passes, the level that represents the real challenge for a trend reversal. Invalidation of this scenario would come with a close below $1,753 accompanied by volume, which would reopen the path toward $1,650 and potentially toward the lower Bollinger Band at $1,485.
Bearish scenario
The bearish scenario assumes that the current area at $1,775 represents an unstable equilibrium destined to give way. If the support at $1,753 is broken, and the current structure of descending EMAs makes this scenario more likely than a bullish acceleration, the next significant level is the $1,650–$1,680 area, a zone of previous structural support. Below $1,600, the market would enter a liquidation phase that could lead ETH to test multi-month lows. Invalidation would come with a sustained recovery above $1,810 with a daily close, which would resolve the immediate pressure.
Those monitoring the Ethereum price in this session must deal with an uncomfortable reality: the market does not offer an obvious opportunity in either direction. The main trend is bearish, momentum does not yet show signs of definitive exhaustion, and the macro context, between extreme fear, high BTC dominance and volumes down 25% in 24 hours, does not favor aggressive positioning.
False breakouts, under these conditions, are frequent: a rebound toward $1,800 could look like a reversal and turn out to be simply an opportunity for those who want to sell at better prices. Patience, in this context, is worth more than any setup.
FAQ
What is the price of Ethereum today?
As of June 17, 2026, Ethereum is trading at around 1,775 dollars, in a context of bearish pressure on the daily timeframe and with a market capitalization that has declined over the last 24 hours.
Is Ethereum in an uptrend or downtrend?
Ethereum is in a structurally bearish regime on the daily, with the main moving averages (EMA20, EMA50, EMA200) all positioned above the current price. Only a recovery above the $1,800–$1,803 area could start to change the short-term technical picture.
What are the key levels to watch for ETH?
The crucial levels are the support at $1,753 (daily S1 pivot) and the resistance at $1,803 (daily R1 pivot). A break of the support would open the way toward the $1,650–$1,680 area, while a break above the resistance would allow targeting the daily EMA50 at $1,954.
{“@context”:”https://schema.org”,”@type”:”FAQPage”,”mainEntity”:[{“@type”:”Question”,”name”:”What is the price of Ethereum today?”,”acceptedAnswer”:{“@type”:”Answer”,”text”:”As of June 17, 2026, Ethereum is trading at around 1,775 dollars, in a context of bearish pressure on the daily timeframe and with a market capitalization that has declined over the last 24 hours.”}},{“@type”:”Question”,”name”:”Is Ethereum in an uptrend or downtrend?”,”acceptedAnswer”:{“@type”:”Answer”,”text”:”Ethereum is in a structurally bearish regime on the daily, with the main moving averages (EMA20, EMA50, EMA200) all positioned above the current price. Only a recovery above the $1,800–$1,803 area could start to change the short-term technical picture.”}},{“@type”:”Question”,”name”:”What are the key levels to watch for ETH?”,”acceptedAnswer”:{“@type”:”Answer”,”text”:”The crucial levels are the support at $1,753 (daily S1 pivot) and the resistance at $1,803 (daily R1 pivot). A break of the support would open the way toward the $1,650–$1,680 area, while a break above the resistance would allow targeting the daily EMA50 at $1,954.”}}]}
Disclaimer: This article is for informational purposes only and does not constitute financial advice, investment recommendation, or a solicitation to buy or sell financial instruments or cryptocurrencies. The analyses do not guarantee future results. Investments in crypto-assets and financial markets involve a high risk of capital loss. Always do your own research (DYOR) and consult a qualified financial advisor before making any decision.
Content created with the assistance of artificial intelligence and with human editorial review.