

As of June 17, 2026, Bitcoin is going through one of the most delicate phases of recent months. The Bitcoin price today is around $65,051, a level that hides a progressively deteriorating technical structure. This is not simple consolidation, but active bearish pressure that is struggling to find convinced buyers.
Summary
Key points
- Bitcoin is trading at $65,051, below all the exponential moving averages on the daily.
- The Fear & Greed Index is at 22, in Extreme Fear territory.
- BTC dominance at 56.2% signals capital concentration, not intrinsic strength.
- The daily pivot point at $65,361 acts as immediate resistance.
- The bearish scenario towards $62,000–$63,000 remains the most likely in the short term.
BTC dominance at 56.2% — according to CoinGecko data — indicates that the capital remaining in the crypto market is concentrating on Bitcoin. However, this is not a sign of strength, but rather a flight of liquidity from altcoins rather than true accumulation. The sector’s total market cap has lost almost 2% in the last 24 hours.
Meanwhile, the Fear & Greed Index stands at 22, classified as Extreme Fear. Those familiar with market cycles know that this condition can precede a technical rebound, but it can also accompany a progressive capitulation. The context does not allow for easy optimism.
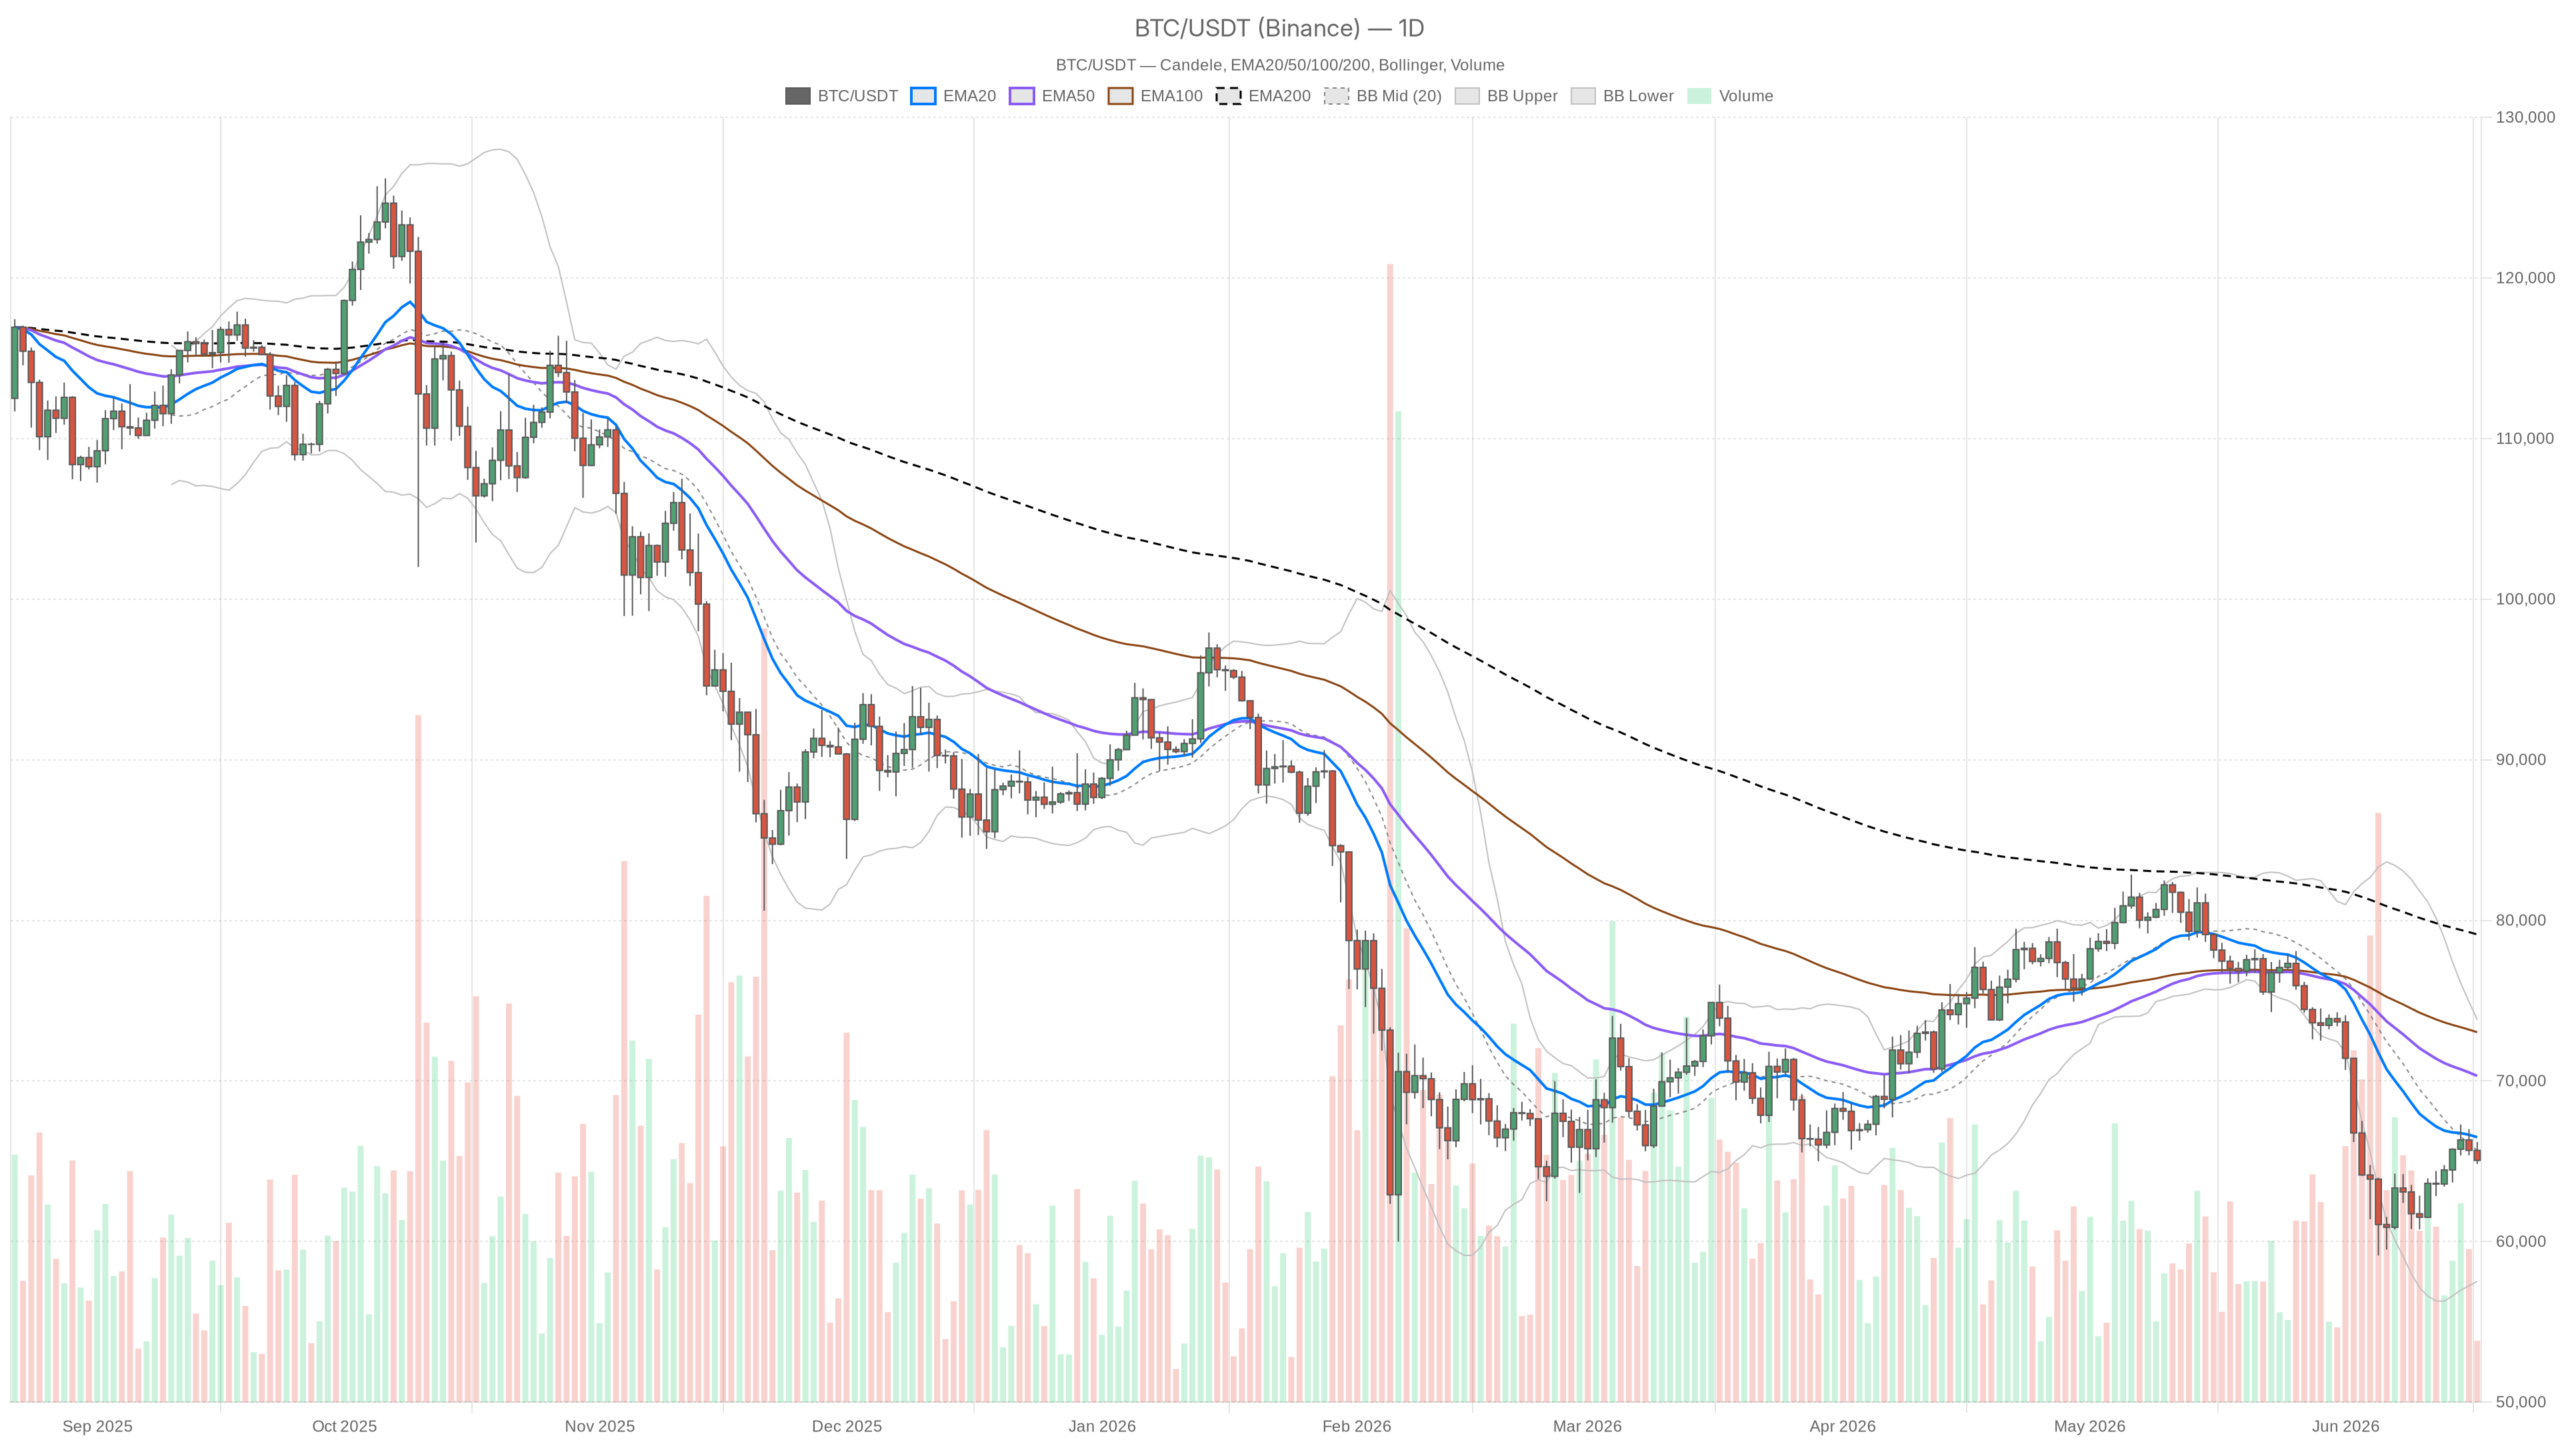
The daily structure: a bearish trend still intact
On the daily timeframe, the picture is clear and leaves no room for creative interpretations. The exponential moving averages tell a story of structural pressure: the EMA20 is at $66,496, the EMA50 at $70,312 and the EMA200 at $79,124. The price is below all three and the descending order of these averages describes a consolidated bearish trend, not a simple retracement. Any potential rebound towards $66,500 should be seen as an opportunity for sellers, not as an imminent reversal.
On the oscillator front, the 14-period RSI on the daily is at 40.17: it is not yet in the classic oversold zone, but it is in a territory that in recent cycles has preceded further declines before any significant recovery. It is not a buy signal; it is a warning that the structure is tired but not yet exhausted to the downside.
The daily MACD shows the line at -2,406 with the signal at -3,045 and the histogram positive at +638. This last element is the only one that might suggest a slowdown in bearish pressure. However, a positive histogram in a strongly negative MACD simply means that the downward momentum is slowing, not that an uptrend is about to start. It is the difference between “the market is falling more slowly” and “the market is about to rise.” In this context, the second reading would be premature.
Finally, the Bollinger Bands on the daily show the middle band at $65,664, slightly above the current price, with the lower band at $57,517. The fact that Bitcoin is hovering below the Bollinger middle band is another indicator of structural weakness. The 14-period ATR is $2,341, a daily volatility range that calls for caution in position management.
The hour and the 15 minutes: the pressure does not ease
Moving to the 1-hour timeframe, the technical regime is classified as neutral, but the internal data tell a different story. The price at $65,076 is below the EMA20 at $65,704 and the EMA50 at $65,746 — both close together and declining. Only the hourly EMA200 at $64,524 lies below, providing theoretical dynamic support.
The hourly RSI has fallen to 34.78, one step away from the oversold zone: selling pressure in recent hours has been substantial and concentrated. Consequently, the hourly MACD is negative with the histogram widening the divergence to -79.98, a sign that short-term momentum is accelerating downward.
On the 15-minute chart, however, the picture worsens further: explicit bearish regime and RSI at 30.88, practically on the oversold threshold. All EMAs — 20, 50, 200 — are above the current price in bearish configuration. The 15-minute MACD confirms this with a histogram at -71.77. This timeframe suggests that in the coming hours any technical rebound will encounter resistance already around $65,430–$65,650.
The levels that really matter
On the technical levels front, the daily pivot point is at $65,361, with R1 at $65,889 and S1 at $64,522. The current price is already below the pivot and this has a precise meaning: today’s session opened in unfavorable territory for buyers. The immediate resistance to beat is the $65,360–$65,890 area. As long as Bitcoin does not recover and consolidate above these levels, any rebound remains technically weak. The key intraday support is at $64,522: an hourly close below this level would open the way towards the lower Bollinger Band, with a first technical target in the $62,000–$63,000 area.
Bullish scenario: possible but conditional
The bullish scenario exists, but it requires precise conditions. For it to materialize, Bitcoin would need to strongly reclaim the $65,900–$66,500 area, surpassing the R1 pivot and approaching the daily EMA20. In that case, the daily RSI rising from the 40 area towards 50+ could signal a regime change and hourly momentum could reverse quickly.
The catalyst could come from geopolitical developments — according to Bloomberg, the Hormuz agreement has already shown how a positive macro headline can move Bitcoin by several hundred dollars in a few hours — or from a change in tone in traditional markets. In this scenario, the first target would be $67,500, with invalidation of the bullish setup placed at a daily close below $64,000.
Bearish scenario: the most likely in the current context
Conversely, the bearish scenario is the one that the current technical structure supports most consistently. If the price fails to reclaim the daily pivot and the hourly RSI formally enters oversold without a rebound, the pressure could push Bitcoin towards $63,500–$62,000 in the short term. The elevated daily ATR at $2,341 makes a move of this magnitude plausible even in a single session. The bearish scenario would be invalidated only by a daily close above $66,500 with expanding volumes, a condition that is currently not visible on the horizon.
How to read this moment
Bitcoin is in a classic technical trap: close enough to supports to look cheap to those who only look at the nominal price, but with a multi-timeframe structure that does not justify aggressive long exposure. Extreme Fear at 22 is a contrarian indicator to keep on the radar.
Historically, buying in these conditions has paid off in the long term. However, operational timing requires confirmations that are not yet present. The main risk today is the false rebound: a recovery towards $65,500–$65,800 that attracts breakout buyers, only to then give way again towards new lows.
Short-term traders must be careful of the trap. That said, those with a longer horizon can start to build an accumulation thesis, but only with reduced size and well-defined stops below $63,500.
FAQ
Why does Bitcoin remain under pressure despite the mid-June rally?
The rally triggered by the US-Iran agreement on the Strait of Hormuz left no structural traces on the chart. Bitcoin has slipped back towards $65,000, with all daily EMAs above the price in a bearish configuration. The multi-timeframe structure remains deteriorated.
What are the key levels to monitor?
The immediate resistance is the $65,360–$65,890 area, corresponding to the daily pivot point and R1. Intraday support is at $64,522: a close below this level would open the way towards the $62,000–$63,000 area.
Is Extreme Fear at 22 a buy signal?
Historically, accumulating in Extreme Fear conditions has paid off in the long term. However, operational timing requires technical confirmations — such as a recovery above $65,900 — that are not yet present. The current context does not allow for easy optimism.
{“@context”:”https://schema.org”,”@type”:”FAQPage”,”mainEntity”:[{“@type”:”Question”,”name”:”Why does Bitcoin remain under pressure despite the mid-June rally?”,”acceptedAnswer”:{“@type”:”Answer”,”text”:”The rally triggered by the US-Iran agreement on the Strait of Hormuz left no structural traces on the chart. Bitcoin has slipped back towards $65,000, with all daily EMAs above the price in a bearish configuration. The multi-timeframe structure remains deteriorated.”}},{“@type”:”Question”,”name”:”What are the key levels to monitor?”,”acceptedAnswer”:{“@type”:”Answer”,”text”:”The immediate resistance is the $65,360–$65,890 area, corresponding to the daily pivot point and R1. Intraday support is at $64,522: a close below this level would open the way towards the $62,000–$63,000 area.”}},{“@type”:”Question”,”name”:”Is Extreme Fear at 22 a buy signal?”,”acceptedAnswer”:{“@type”:”Answer”,”text”:”Historically, accumulating in Extreme Fear conditions has paid off in the long term. However, operational timing requires technical confirmations — such as a recovery above $65,900 — that are not yet present. The current context does not allow for easy optimism.”}}]}
Disclaimer: This article is for informational purposes only and does not constitute financial advice, investment recommendation or a solicitation to buy or sell financial instruments or cryptocurrencies. The analyses do not guarantee future results. Investments in crypto-assets and financial markets involve a high risk of capital loss. Always do your own research (DYOR) and consult a qualified financial advisor before making any decision.
Content created with the assistance of artificial intelligence and with human editorial review.