

Strategy stock is under mounting technical pressure. MSTR closed at $112.53 on June 18, trading beneath every major moving average on the daily chart. Both daily and hourly timeframes confirm a firmly bearish regime, leaving limited room for near-term bullish optimism.
Summary
Key takeaways
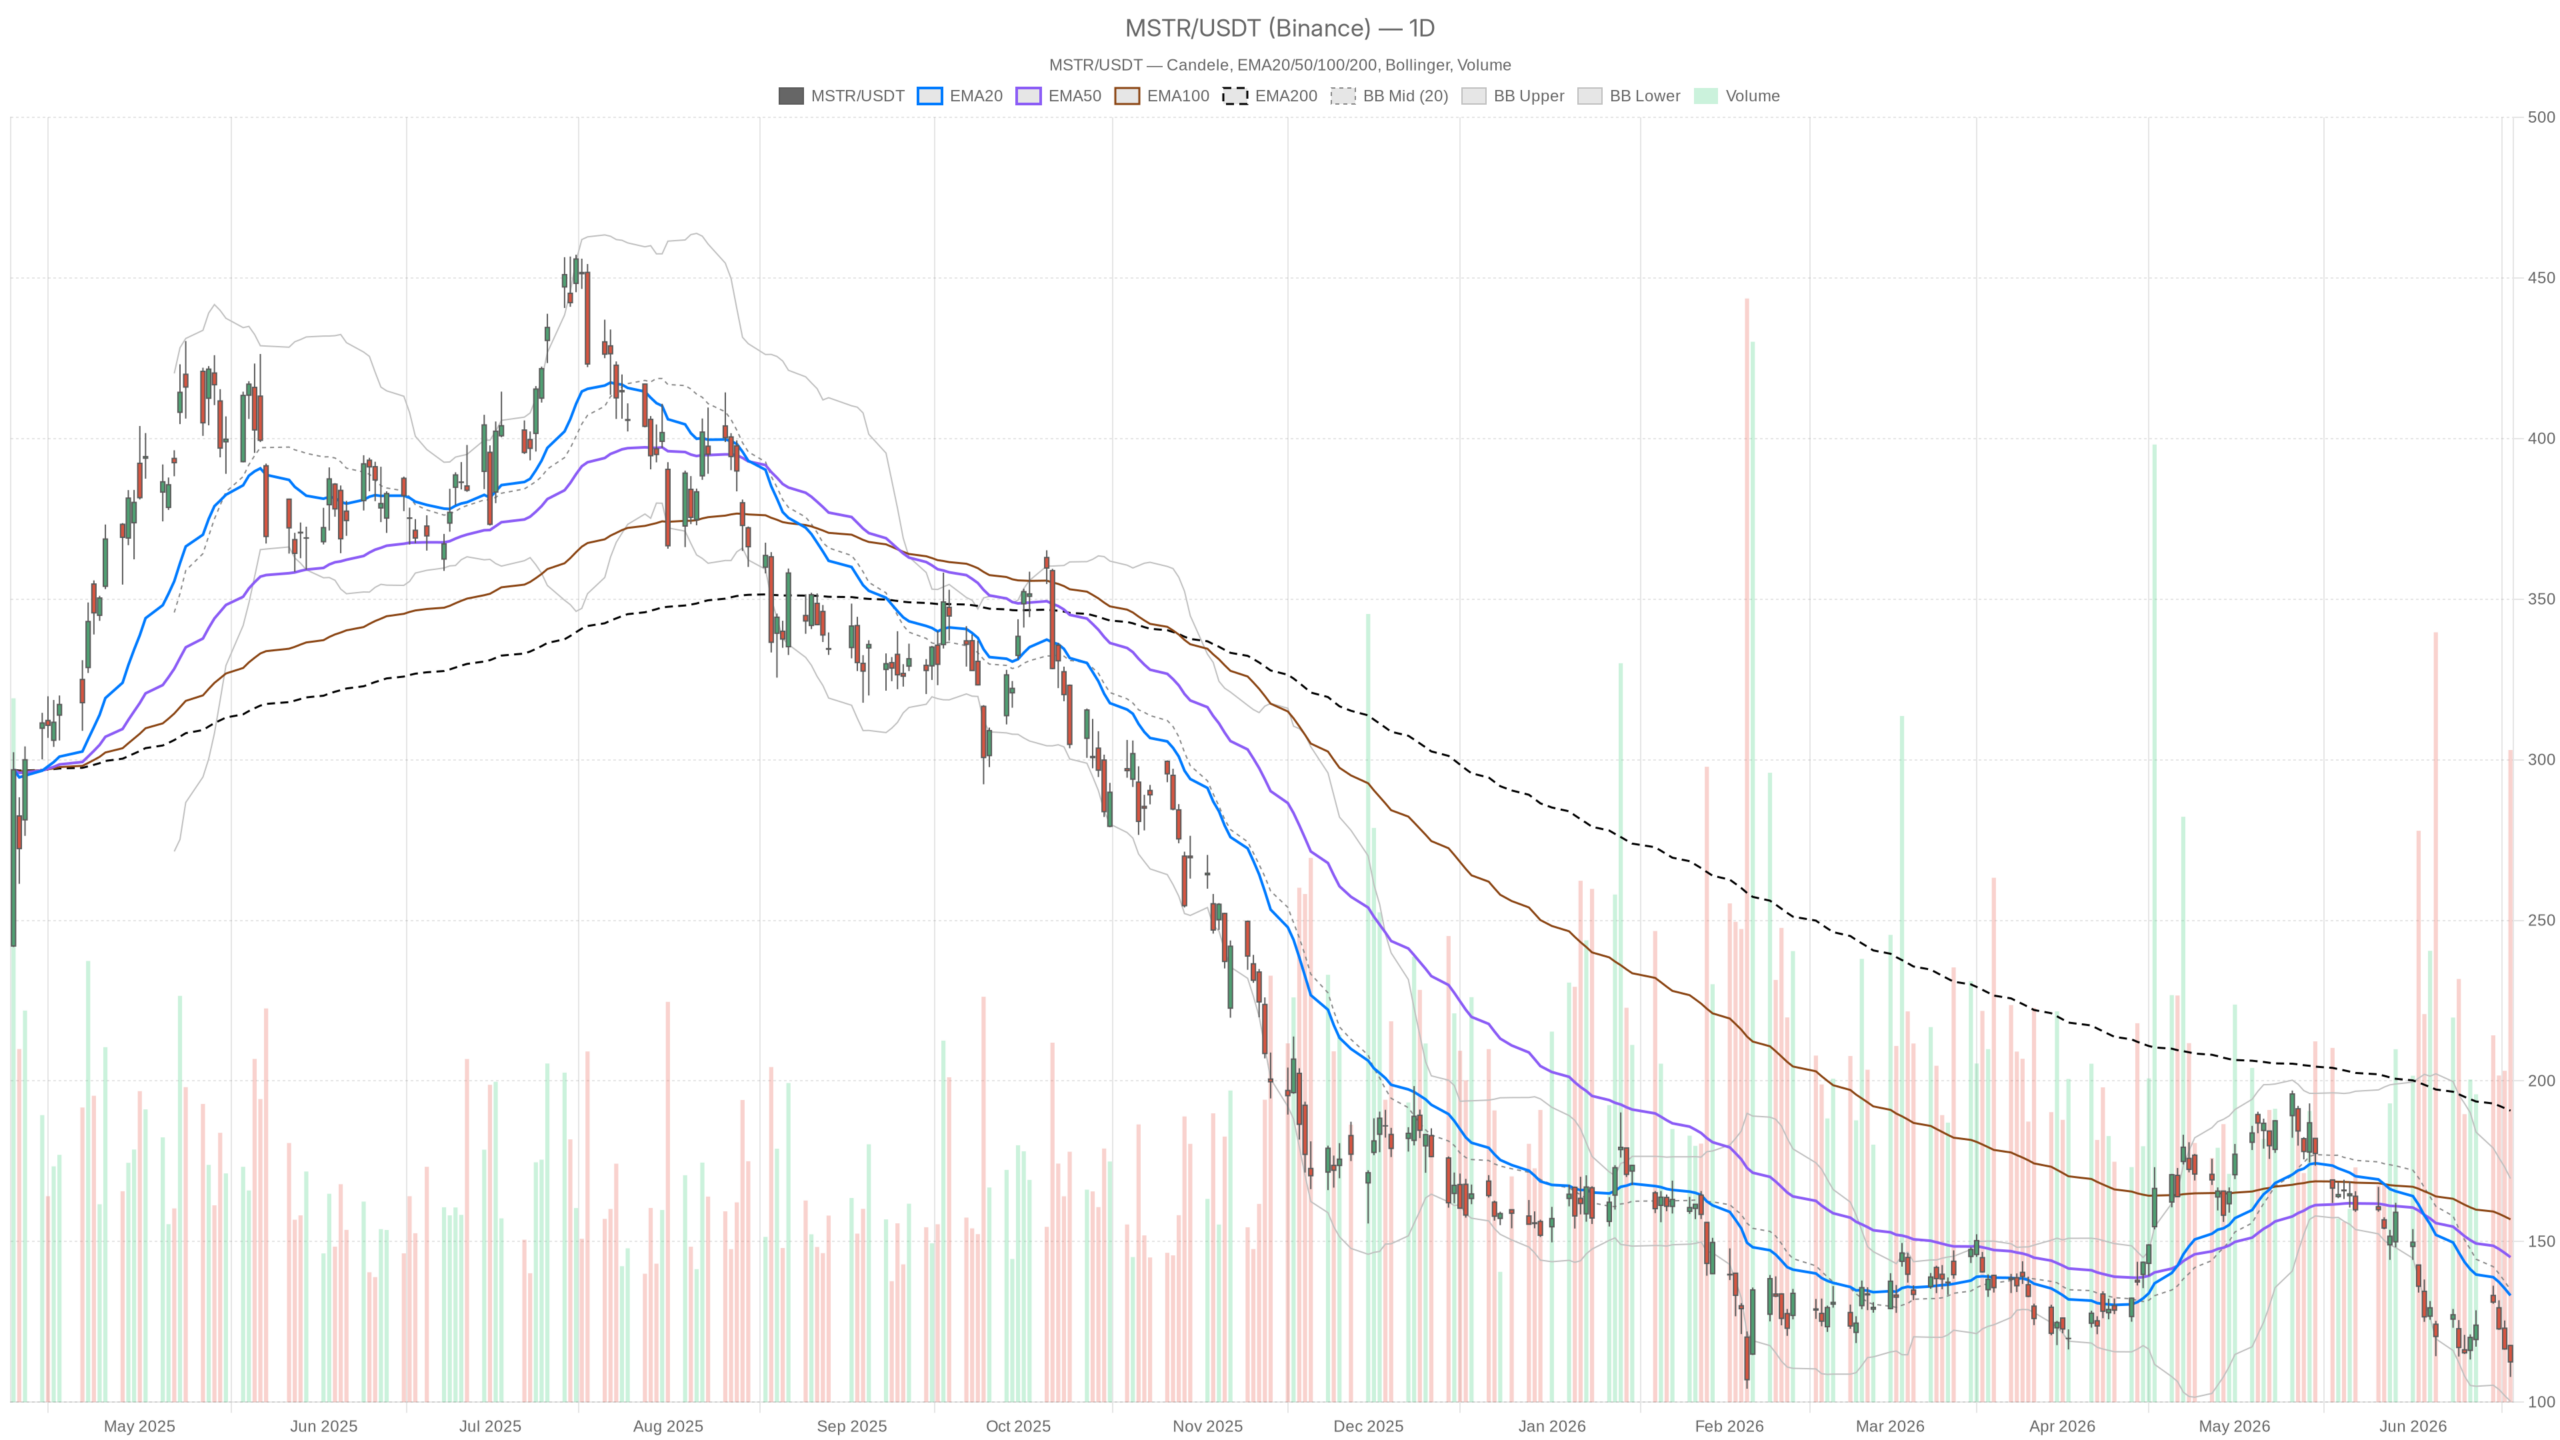
- MSTR closed at $112.53, well below its 20-day EMA at $133.21 and 50-day EMA at $145.12.
- Daily RSI at 34.04 approaches oversold territory without yet triggering a reversal signal.
- MACD remains negative with a widening divergence on the daily timeframe.
- The lower Bollinger Band at $100.25 represents the next meaningful support level.
- The July 4 CLARITY Act deadline serves as the nearest potential catalyst for a trend shift.
Daily chart confirms a deeply bearish structure
The daily chart leaves no ambiguity. MSTR is in a firmly bearish trend with price buried beneath all key moving averages. Most striking is the gap between price and its key EMAs. MSTR closed at $112.53 while the 20-day EMA sits at $133.21, the 50-day at $145.12, and the 200-day at a distant $190.74.
That stacking of EMAs far above price is not a minor lag. It reflects months of sustained selling pressure. The stock has lost nearly 69% of its value over the past year. Price is not just below trend. It is buried under it.
Momentum indicators signal further deterioration
At 34.04, the daily RSI approaches oversold territory but has not yet triggered a classic reversal signal. Meanwhile, the MACD line sits at -11.93 versus a signal of -10.71, with a negative histogram of -1.21. Momentum is still deteriorating. No bullish crossover is in sight on this timeframe. Notably, the divergence is widening rather than compressing.
Bollinger Bands and pivot levels frame the risk
Bollinger Bands on the daily add further context. The midline is at $134.93, and price at $112.53 trades in the lower half of the band. The lower band rests at $100.25, which represents meaningful downside if selling accelerates. That distance of roughly $12 from current price is not abstract. The ATR of $10.83 confirms that MSTR moves in large daily ranges. Volatility is elevated, and that cuts both ways.
Daily pivot levels place the pivot point at $112.71. Resistance sits at $117.57 and support at $107.67. MSTR closed essentially at the pivot, a neutral short-term anchor. However, given the broader trend, neutrality at the pivot is not reassuring. It simply means the stock has not yet broken to new lows from this session.
Hourly timeframe reinforces the bearish regime
The hourly chart fully mirrors the daily bearish structure. Seller dominance is confirmed across both timeframes without any sign of recovery momentum. The 1H close of $112.56 sits below the 20-hour EMA at $117.21. It also trails the 50-hour at $121.59 and the 200-hour at $140.67. The structural pattern mirrors the daily: price beneath all key levels.
Hourly RSI at 35.46 echoes the daily reading. It remains weak, not yet floored, and points to continued seller dominance. The MACD histogram on the 1H is also negative at -1.06, reinforcing the trend.
15-minute chart offers a flicker, not a reversal
In contrast, the 15-minute frame tells a slightly different story. RSI has recovered to 50.52, a neutral reading. The MACD histogram flipped positive at +0.74, suggesting short-term buying momentum within the session. Price closed above the 15-minute EMA20 at $111.54.
However, this should not be mistaken for a trend change. It is intraday positioning, likely a modest bounce from the lower end of the daily range. The 15-minute data is useful for entry timing, not for forming a market thesis.
Fundamental headwinds weigh on Strategy stock
Strategy stock faces growing fundamental pressure. Analysts increasingly question whether the company’s Bitcoin accumulation model still generates shareholder value. Strategy recently purchased $100 million worth of Bitcoin, continuing its playbook of share issuance to fund BTC accumulation. Yet veteran analysts are questioning whether this model still generates value.
Dilutive equity issuance combined with a potentially hawkish Federal Reserve under incoming Chair Kevin Warsh has created a troubling setup. One analyst has floated a path back toward $65. That scenario aligns uncomfortably well with what the daily chart is suggesting.
Additionally, Michael Saylor briefly addressed the selloff in Strategy’s preferred stock. The fact that he commented at all signals pressure beyond the common shares. Meanwhile, the broader market is watching the July 4 deadline for the CLARITY Act. This legislation could reshape crypto regulation in the United States. The catalyst is a double-edged sword. A favorable outcome could lift Bitcoin-linked equities like MSTR. A disappointing or delayed result would remove one of the few remaining bullish arguments for the stock near-term.
Bullish vs bearish: two paths for Strategy stock
The path of least resistance for Strategy stock remains downward. However, a Bitcoin rally and favorable regulation could shift the technical structure. The bullish scenario requires several things to align simultaneously. Bitcoin would need to mount a meaningful rally, not just a dead-cat bounce. Regulatory clarity from the CLARITY Act could improve sentiment toward crypto-linked equities.
Technically, MSTR would need to reclaim the $117.57 resistance level. From there, it must push toward the daily EMA20 at $133.21 to begin shifting the trend structure. That remains a significant distance to cover. A sustained move above $120 would be the first indication that sellers are losing control.
Why the downside risk remains dominant
On the other hand, the bearish scenario is far easier to construct. If Bitcoin weakens further and the CLARITY Act disappoints, very little technical support exists between current levels and the lower band. The gap between $112 and $100.25 offers no meaningful buffer. Below that, the $65 target cited by analysts becomes a genuine conversation. The MACD trend on the daily has room to deteriorate further before hitting exhaustion. There is no price-based evidence of institutional accumulation at these levels yet.
Key levels and volatility outlook
Strategy stock demands disciplined risk management given elevated volatility. The $100.25 level serves as critical support. Meanwhile, the $117–$120 zone must be reclaimed for any meaningful trend shift. Overall, MSTR is a high-volatility, Bitcoin-correlated asset in a confirmed downtrend across both daily and hourly timeframes. The intraday bounce on the 15-minute chart offers no structural comfort.
Positioning here demands respect for the dominant bearish regime. Disciplined risk management is essential given the wide ATR. Close attention to the July 4 regulatory deadline is warranted as the nearest potential inflection point. Until price reclaims meaningful ground above the $117–$120 zone, the path of least resistance remains downward.
FAQ
What is the current technical outlook for Strategy stock?
Strategy stock is in a firmly bearish regime. MSTR closed at $112.53 on June 18, trading below its 20-day EMA at $133.21, 50-day EMA at $145.12, and 200-day EMA at $190.74. Both the daily and hourly timeframes confirm seller dominance with no recovery signals.
What are the key support and resistance levels for MSTR?
Key support sits at $100.25, represented by the lower daily Bollinger Band. Below that, analysts have cited a potential target of $65. On the upside, $117.57 is the nearest resistance. The daily EMA20 at $133.21 serves as a more significant barrier to any recovery.
What catalyst could shift Strategy stock’s trend?
The July 4 CLARITY Act deadline is the nearest potential inflection point. Favorable crypto regulation could lift Bitcoin-linked equities like MSTR. Conversely, a disappointing or delayed outcome would remove one of the few remaining bullish catalysts for the stock short-term.
Is the 15-minute chart signaling a reversal?
No. The 15-minute RSI recovery to 50.52 and positive MACD histogram reflect intraday positioning, not a structural trend change. These short-term signals are useful for entry timing only. The dominant bearish regimes on the hourly and daily charts remain firmly in control.
Disclaimer: This article is for informational purposes only and does not constitute financial advice, an investment recommendation, or a solicitation to buy or sell any financial instrument or cryptocurrency. The analysis provided is not indicative of future results. Investing in crypto assets and financial markets carries a high risk of capital loss. Always do your own research (DYOR) and consult a qualified financial advisor before making any decision.
Article produced with the assistance of artificial intelligence and reviewed by the editorial team.