




Lucid Stock closed Thursday at $6.98 after a sharp reversal session. Price sank to $6.60, then surged to $7.12 before settling near the highs. A constructive candle inside a damaged chart. The daily bias stays neutral, not bullish.
Summary
Key takeaways
- Lucid Stock closed at $6.98 on Thursday with a daily bias that remains neutral, not bullish.
- Price sits above the 20-day EMA at $6.94 and 50-day EMA at $6.64, but the 200-day EMA at $10.20 confirms a bearish medium-term trend.
- Daily ATR at $0.84 represents roughly 12% of the share price, making support and resistance zones rather than precise lines.
- The 1H chart shows price capped below both fast EMAs, while the 15m chart is coiled between $6.91 and $7.01.
- Buyers must reclaim the $7.03–$7.17 EMA cluster to flip the hourly structure; failure keeps the bearish lower-high sequence intact.
The context matters. LCID has been through an earnings miss, a widening loss and rising cash burn. A $1.4 billion operational reset was announced under new CEO Silvio Napoli. Management also delayed the midsize Cosmos and cut production of other models. Meanwhile, the CEO publicly denied take-private talks after a violent whipsaw. In other words, the fundamental narrative is in transition. The chart reflects a market that has not decided yet.
Daily Structure: Repair Above the Short EMAs, Damage Below the Long One
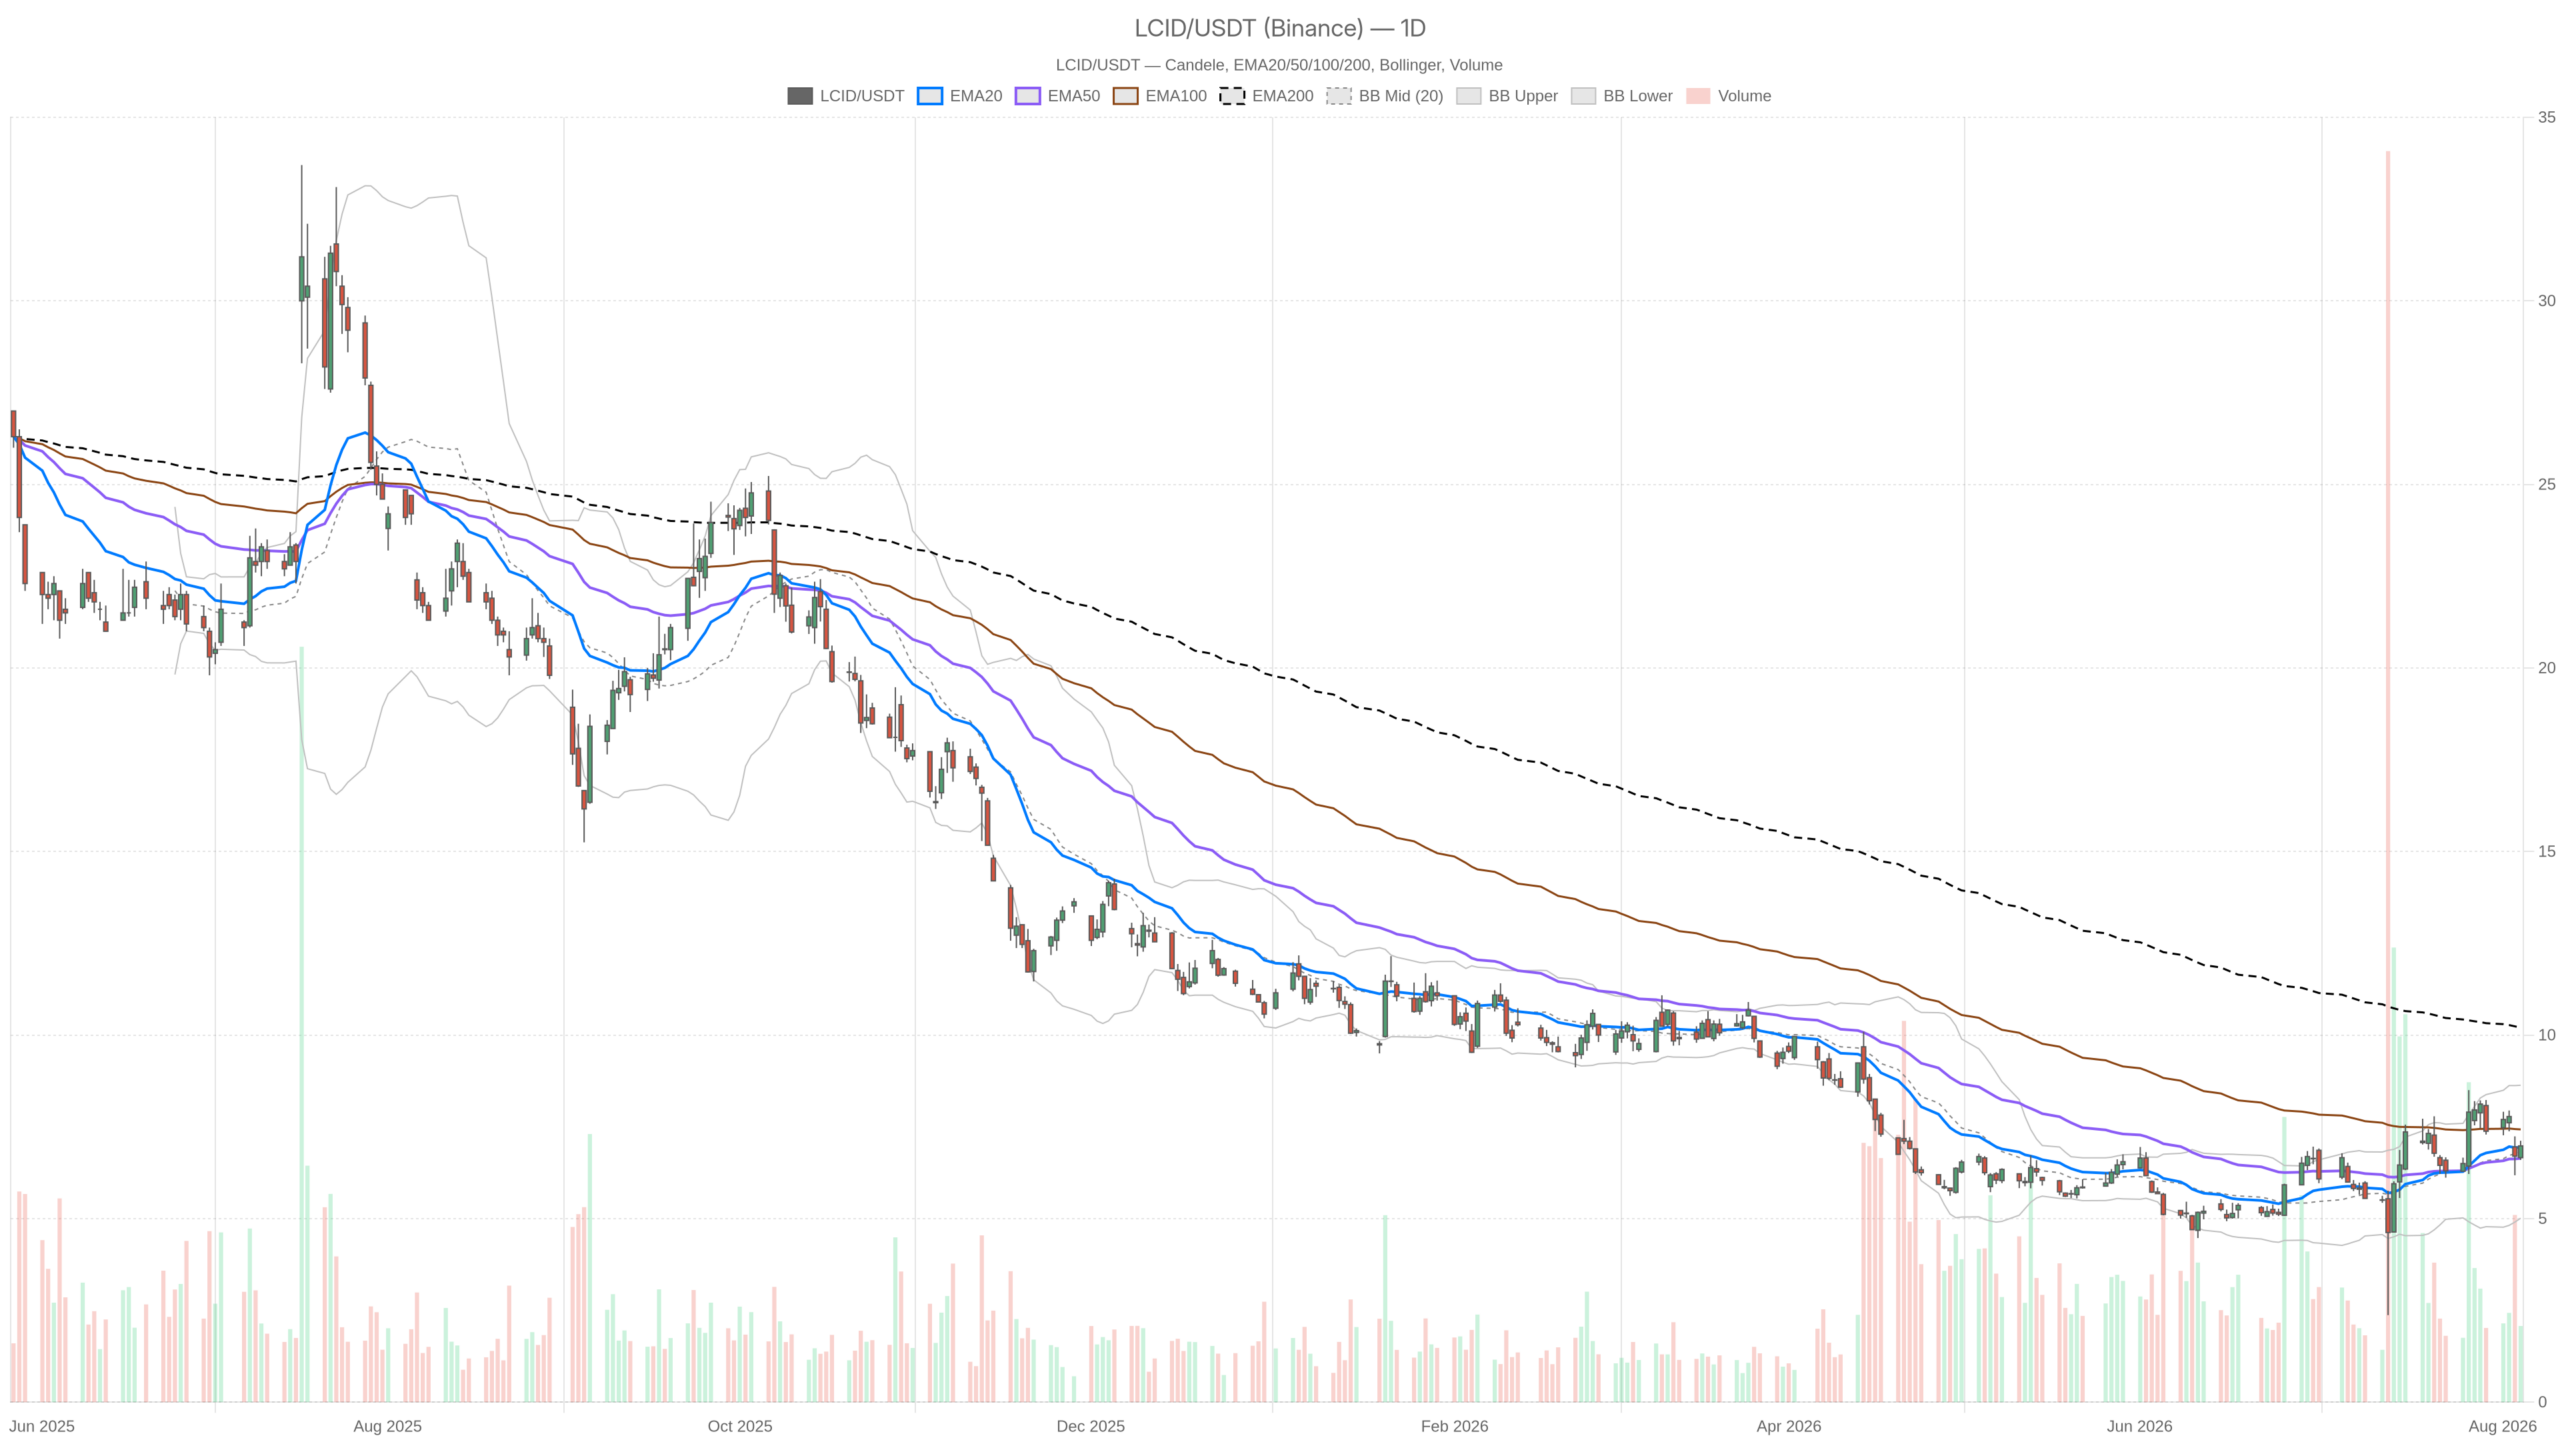
The daily chart for Lucid Stock shows a split structure. Price holds above short-term moving averages but sits far below the 200-day EMA. That keeps the medium-term trend firmly bearish.
Notably, price at $6.98 sits above the 20-day EMA at $6.94 and comfortably above the 50-day EMA at $6.64. That combination confirms a short-term base has been built over recent weeks. However, the 200-day EMA sits far overhead at $10.20. The distance is enormous. It defines the dominant medium-term trend as bearish.
Momentum reflects that ambivalence. Daily RSI at 51.76 is almost perfectly balanced. It shows neither exhaustion nor renewed buying pressure. The MACD line at 0.36 remains above zero. That is a residual positive. However, the signal line at 0.38 sits marginally higher and the histogram has flipped to -0.02. Therefore the daily momentum push that carried price off the lows is fading rather than accelerating.
Volatility Dominates the Trading Landscape
Bollinger Bands add the volatility dimension. The daily mid-band is $6.82, with the upper edge at $8.63 and the lower edge at $5.01. That is an extraordinarily wide envelope for a $7 stock. It tells you the market has traded through violent swings and has not compressed since. Price holding just above the mid-band is a mild positive, nothing more.
Volatility itself is the single most important number here. Daily ATR at $0.84 implies an average true range worth roughly twelve percent of the share price. Any level-based reasoning on Lucid Stock has to respect that. Support and resistance are zones, not lines. Stops placed tightly will be taken out by noise alone.
Meanwhile, the daily pivot map frames the immediate battlefield. The pivot point sits at $6.90, with resistance at $7.20 and support at $6.68. Thursday’s close above the pivot keeps the short-term balance slightly in favour of buyers. Notably, the session high of $7.12 stalled just under R1. That is where the first real seller interest showed up.
The 1H Timeframe Weakens the Case
The hourly chart weakens the recovery case for Lucid Stock. Price trades below both fast EMAs, confirming persistent distribution pressure from post-earnings supply.
The last 1H close was $6.97, below the 1H EMA20 at $7.03 and clearly below the 1H EMA50 at $7.16. Price trading beneath both fast averages is the signature of a market still working off distribution from higher levels. That is the post-earnings supply overhang in visual form.
At the same time, the 1H EMA200 at $6.63 is well below price. So the intraday structure is not broken; it is capped. Hourly RSI at 45.38 sits under the midline. That confirms short-term momentum still leans mildly negative.
There is, however, a genuine flicker of improvement. The 1H MACD line at -0.14 remains below zero. Yet the signal at -0.17 is lower and the histogram has turned positive at 0.03. Downside momentum is decelerating. That is an early stabilisation signal, not a reversal signal.
Meanwhile, the 1H Bollinger structure reinforces the ceiling. The mid-band sits at $7.05, directly above the market, with bands at $7.94 and $6.17. Hourly ATR of $0.28 means a typical hour can travel a quarter of the distance between the pivot and R1. In short, the conflict between timeframes is real. The daily is neutral with a constructive tilt, while the hourly still reads as a shallow downtrend inside a wide range.
15m Execution Context
The 15-minute chart is the cleanest of the three timeframes. It is quietly balanced, with compressed volatility that signals an imminent breakout.
Price at $6.97 sits above the 15m EMA20 of $6.93 and just above the EMA50 of $6.95. RSI stands at 55.91. The MACD is flat at 0.04 with a zero histogram, which is textbook equilibrium. Bollinger Bands have compressed hard, spanning only $6.89 to $7.01. The 15m ATR has collapsed to $0.07.
That compression is the most actionable short-term detail. Volatility this tight after a violent news cycle rarely persists. The $7.01 pivot resistance and $6.91 pivot support mark the immediate boundaries of the coil. Meanwhile, the 15m EMA200 at $7.17 lines up almost exactly with the 1H EMA50. That creates a confluence zone bulls must clear to change the tone.
Bullish Scenario for Lucid Stock
The bullish path for Lucid Stock requires reclaiming the $7.03–$7.17 EMA cluster. Clearing that zone would flip the hourly structure and open the way toward daily R1 at $7.20.
In practice, the constructive path starts with acceptance above the daily pivot at $6.90. Then buyers need a break of the 15m cap near $7.01. From there, the $7.03–$7.17 band must be cleared. That is where the 1H EMA20, 1H EMA50 and 15m EMA200 cluster. A decisive close above this band would confirm the shift.
At the same time, supporting evidence would include the daily MACD histogram turning positive again. Daily RSI pushing decisively through 55 would also help. The 1H histogram needs to continue expanding above zero. Volume matters too. Thursday’s 9.48 million shares came on a strong recovery candle. Follow-through participation would give that reversal credibility. Beyond the chart, the market would need to treat the $1.4 billion reset as a credible path. The 100-robotaxi programme with Uber and Nuro must also be seen as strategic rather than a cost-driven retreat.
Bearish Scenario and What Breaks the Bulls
The bearish case for Lucid Stock is better supported by hourly data. As long as price fails under the $7.03–$7.16 EMA band, every rally attempt remains a lower-high sequence.
However, a loss of the 15m support at $6.91 would be the first warning. That, followed by a break of the daily S1 at $6.68, would confirm the recovery candle was a liquidity event, not a trend change.
Below that, the 1H EMA200 at $6.63 and the 50-day EMA at $6.64 form the last meaningful shelf. Losing it would put the daily lower Bollinger band at $5.01 back into the conversation. The wide envelope makes that a realistic possibility. The bullish thesis is invalidated the moment price closes back under the 20-day EMA at $6.94. The daily MACD line rolling toward zero would confirm the breakdown.
Overall, this is a mixed chart and it should be treated as one. The daily regime is neutral. The hourly leans defensive. The 15-minute chart is coiled between $6.91 and $7.01. With the 200-day EMA still $3 above the market, the burden of proof sits firmly with buyers. Position sizing, not level precision, is the real variable when daily ATR runs near twelve percent of price. The post-reset fundamental story has yet to produce a single quarter of confirmation.
FAQ
What is the current outlook for Lucid Stock?
The daily bias for Lucid Stock remains neutral, not bullish. Price at $6.98 sits above the 20-day and 50-day EMAs but far below the 200-day EMA at $10.20. The daily RSI at 51.76 reflects a perfectly balanced market with no clear directional momentum.
What are the key support and resistance levels for LCID?
Immediate resistance sits at the $7.03–$7.17 EMA cluster, followed by daily R1 at $7.20. Support starts at the 15m pivot support of $6.91, then daily S1 at $6.68. The last meaningful shelf is at $6.63–$6.64, where the 1H EMA200 and 50-day EMA converge.
Is Lucid Stock bullish or bearish on the hourly timeframe?
The hourly chart leans defensive. Price at $6.97 trades below both the 1H EMA20 at $7.03 and the 1H EMA50 at $7.16. Hourly RSI at 45.38 sits under the midline. However, the 1H MACD histogram has turned positive, suggesting downside momentum is decelerating.
Why does the daily ATR matter for Lucid Stock?
Daily ATR at $0.84 represents roughly twelve percent of the share price. This means support and resistance should be treated as zones, not precise levels. Tight stops will likely be taken out by normal volatility alone. Position sizing matters more than level precision in this environment.
Disclaimer: This article is for informational purposes only and does not constitute financial advice, an investment recommendation, or a solicitation to buy or sell any financial instrument or cryptocurrency. The analysis provided is not indicative of future results. Investing in crypto assets and financial markets carries a high risk of capital loss. Always do your own research (DYOR) and consult a qualified financial advisor before making any decision.
Article produced with the assistance of artificial intelligence and reviewed by the editorial team.
