

As of late June 2026, Cardano crypto trades at $0.15 amid brutal market conditions. Total market cap shed 2.6% in 24 hours, Bitcoin dominance nears 56%, and the Fear & Greed Index hit 13 — extreme fear. Strong assets struggle to hold bids, and ADA is not strong right now.
Summary
Key takeaways
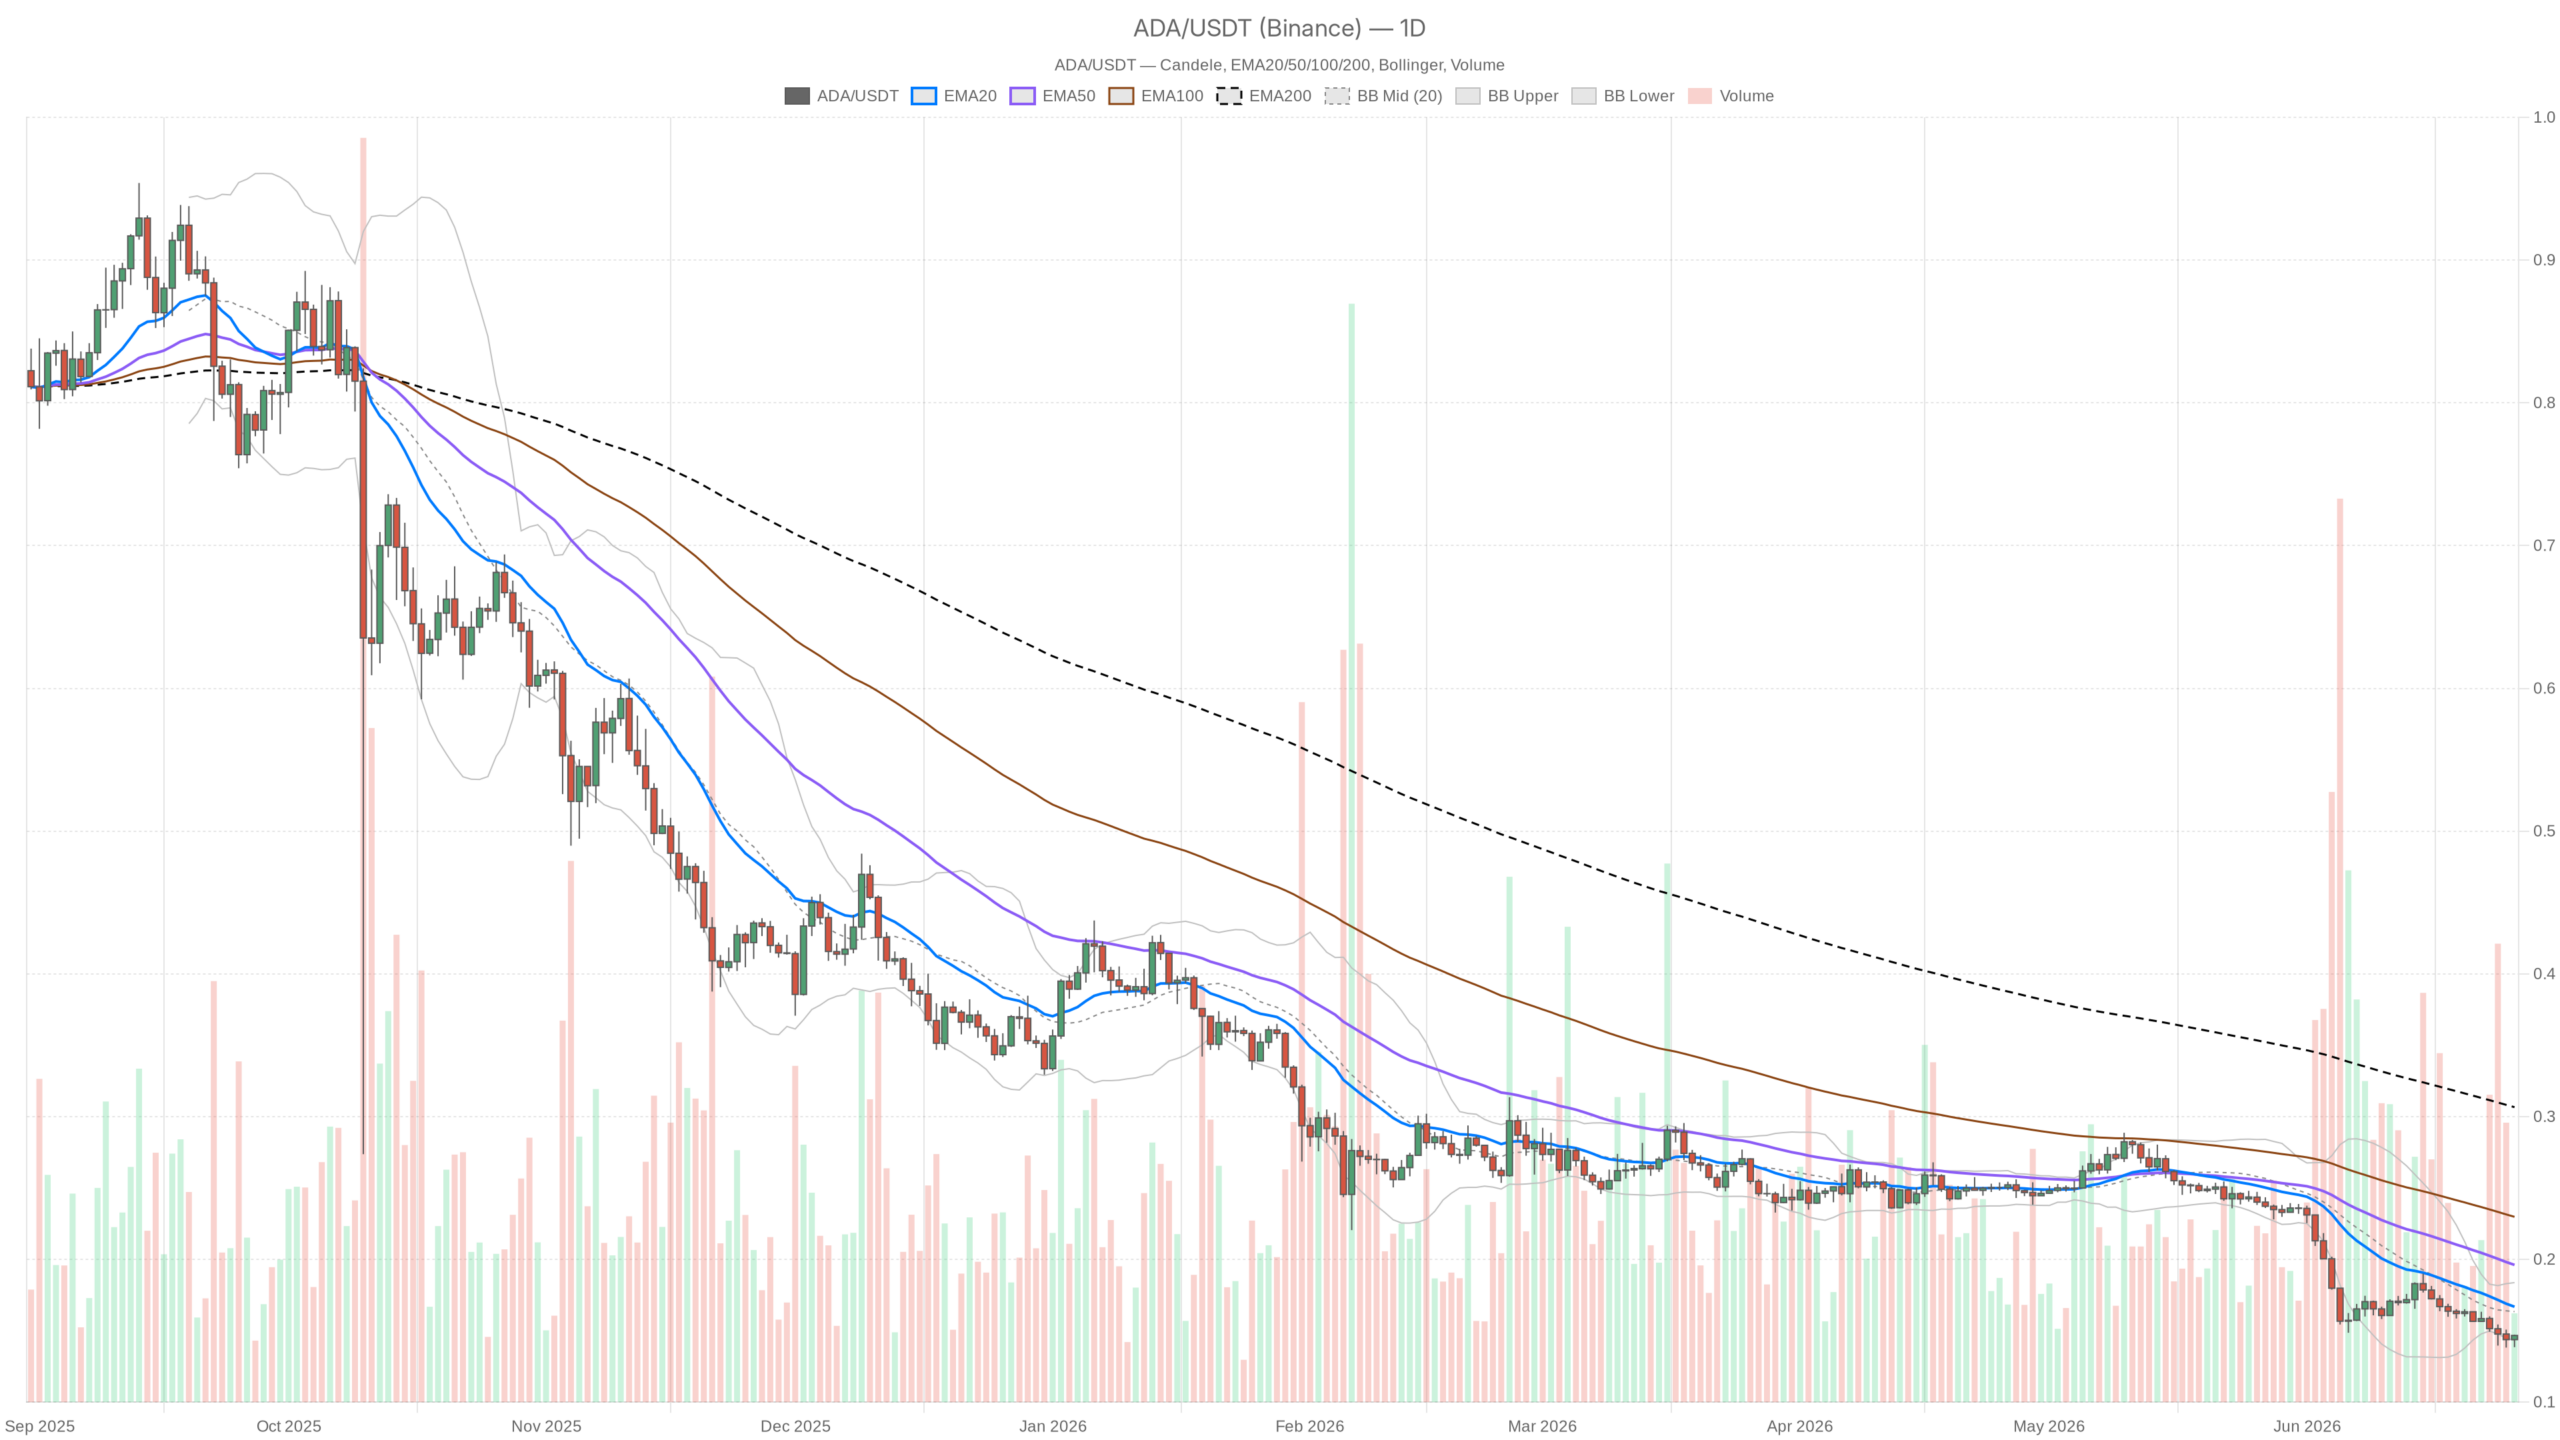
- ADA trades at $0.15, sitting below all major daily EMAs in a fully stacked bearish alignment
- Daily RSI at 28.39 signals oversold conditions, but no structural reversal confirmation exists yet
- Fear & Greed Index at 13 reflects extreme fear across the broader crypto market
- Cardano DEX activity shows ecosystem resilience despite price weakness, with Minswap up 30% and SundaeSwap up 32% weekly
- A daily close above $0.17 would be the first credible bullish signal; a break below $0.14 opens new downside risk
The Daily Picture: Bearish Structure, Oversold Conditions
The regime is unambiguously bearish on the daily timeframe, which defines the macro bias. Price at $0.1500 sits below the 20-day EMA at $0.17, below the 50-day EMA at $0.20, and far below the 200-day EMA at $0.31. This is a fully stacked bearish alignment. Every major moving average acts as overhead resistance, and price has not been able to challenge any of them meaningfully. The gap between current price and the 200 EMA alone — over 100% — reveals the damage done to the longer-term trend structure.
The daily RSI at 28.39 is technically in oversold territory, sitting below the classic 30 threshold. However, that is not a buy signal on its own. In extended downtrends, RSI can stay pinned below 30 for weeks. What matters is whether there is any structural confirmation of a reversal — and right now, there is none. The MACD on the daily shows both line and signal at -0.02 with a flat histogram. There is no cross, no curl, and no divergence worth acting on. The momentum picture remains stale and slightly negative.
Bollinger Bands on the daily have the price hugging the lower band at $0.14, with the midline at $0.16 and the upper band at $0.18. When price compresses this close to the lower band while the bands themselves are relatively tight, it typically signals either a coil before a move or continued grinding exhaustion. Moreover, with extreme fear prevailing, BTC dominance rising, and total market cap falling, the odds favor the latter unless something changes externally.
Pivot analysis from recent Binance data places the pivot point at $0.14, with R1 and S1 both clustering around the same $0.14–$0.15 range. That compression of pivot levels signals price has been range-bound in an incredibly tight zone, essentially trading sideways at the low. This can either be base-building or just dead weight, depending on who blinks first.
Intraday Signals: A Flicker, Not a Fire
The 1-hour chart presents an interesting but unconvincing contrast. The regime reads as neutral, with price at $0.15 now sitting above both the 20 EMA ($0.14) and the 50 EMA ($0.15), while the RSI sits at 56.38. That is mildly constructive intraday momentum. Buyers have shown up at the lows on shorter timeframes and pushed price back above near-term averages. However, the 1H 200 EMA sits at $0.16, and that is the wall. Until ADA can close an hourly candle above $0.16 with conviction, this intraday uptick remains noise within the daily downtrend.
The 15-minute chart flashes an RSI reading of 71.39 — overbought on the shortest timeframe. This kind of micro-signal matters only for entries and exits, not for directional bias. What it tells us practically is that the short-term bounce has already extended. Consequently, chasing right now means buying into short-term exhaustion. A pullback to $0.145–$0.148 on the 15-minute would offer a cleaner setup for anyone inclined to trade the range.
The Cardano Ecosystem: A Faint Pulse
On-chain activity in the Cardano DeFi ecosystem, tracked via DefiLlama, shows that Minswap DEX recorded a 30.41% increase in fees over the past seven days, and SundaeSwap V2 saw a 32.38% weekly uptick. WingRiders added 21.13% on the same basis. These are not massive numbers in absolute terms — Minswap‘s daily average sits around $2.1M — but the directional trend on the weekly suggests a pickup in DEX activity on the network. The disconnect between network activity ticking up and Cardano crypto continuing to drop is a tension worth watching: historically, ecosystem usage can precede price recovery, but it is not a guarantee.
Bull Case: What Would Need to Happen
The credible bull case starts with a daily close above $0.17 — the 20-day EMA. That would be the first structural reclaim worth paying attention to. If ADA can push through $0.17 on volume, with the daily RSI crawling back above 35–40, the argument shifts from dead cat bounce to potential base formation. Furthermore, a sustained move toward $0.20 would require a broader market recovery — BTC holding above its own key levels, fear sentiment lifting, and probably some Cardano-specific catalyst. This scenario is invalidated quickly if price fails to hold $0.14 on a daily closing basis.
Bear Case: The Path of Least Resistance
The bear case is simpler and better supported by current data. If BTC dominance continues rising and total market cap keeps declining, ADA has no reason to decouple to the upside. A break below $0.14 — the lower Bollinger Band and pivot support — opens a path toward price discovery in territory not seen in years. That said, the daily RSI being oversold does not prevent this outcome; it just means the move lower would come from an already-depressed base. This scenario is invalidated only if ADA manages a convincing daily reclaim of $0.17 with follow-through volume.
Positioning and Risk Considerations
The honest assessment here is that ADA is in a difficult spot — not in free-fall, but not showing the kind of strength that justifies aggressive long exposure. The daily trend is bearish, the macro backdrop remains hostile, and the intraday bounce is running into short-term exhaustion. The oversold daily RSI offers a theoretical floor, but floors only matter when buyers are willing to defend them with size.
For those already holding, the $0.14 level is the line in the sand — a daily close below it removes the last visible support argument. For those watching from the sidelines, patience is being rewarded. The range is tight, volatility is low, and the next directional move will likely be sharper than recent price action suggests. With the Fear & Greed Index at 13, the market is priced for capitulation, not recovery. That does not mean recovery is not coming. It means the timing remains genuinely uncertain, and position sizing should reflect that reality.
FAQ
Is Cardano oversold right now?
Yes, the daily RSI sits at 28.39, below the classic 30 threshold. However, oversold conditions in extended downtrends can persist for weeks and do not guarantee an immediate reversal.
What is the key support level for ADA?
The $0.14 level serves as the critical support, coinciding with the lower Bollinger Band and the pivot point. A daily close below this level would remove the last visible support argument.
What would signal a trend reversal for Cardano?
A daily close above $0.17 — the 20-day EMA — would be the first structural reclaim worth attention. Moreover, sustained movement toward the 50-day EMA at $0.20 would require broader market recovery and likely a Cardano-specific catalyst.
Is Cardano DeFi still active despite the price drop?
Yes. Minswap DEX recorded a 30.41% fee increase over seven days, and SundaeSwap V2 saw a 32.38% weekly uptick, suggesting the ecosystem is not dormant even as the token price suffers.
Disclaimer: This article is for informational purposes only and does not constitute financial advice, an investment recommendation, or a solicitation to buy or sell any financial instrument or cryptocurrency. The analysis provided is not indicative of future results. Investing in crypto assets and financial markets carries a high risk of capital loss. Always do your own research (DYOR) and consult a qualified financial advisor before making any decision.
Article produced with the assistance of artificial intelligence and reviewed by the editorial team.